Belgian Shepherd Varieties
Why population size matters
Simulations of inbreeding
There are four Belgian varieties that vary considerably in population size. The Laekenois is the least populous and the Tervuren is most. Throughout the history of the breed, the variety designations have changed multiple times. Currently, except in the US, the four varieties are considered a single breed although cross-breeding might be permitted with permission. In the US they are treated as separate, "pure" breeds.
What we choose to call the varieties and whether we treat them as separate breeds or just varieties has profound implications for the genetics of the populations. Most basically, small, closed populations accumulate inbreeding more quickly. This is predictable and unavoidable.
Here are some examples generated by a simple computer model that assumes random mating of individuals in a population of a specified size and initial level of inbreeding. We will run the simulation for 50 generations and always start with a population that is not inbred. Here are some examples:
|
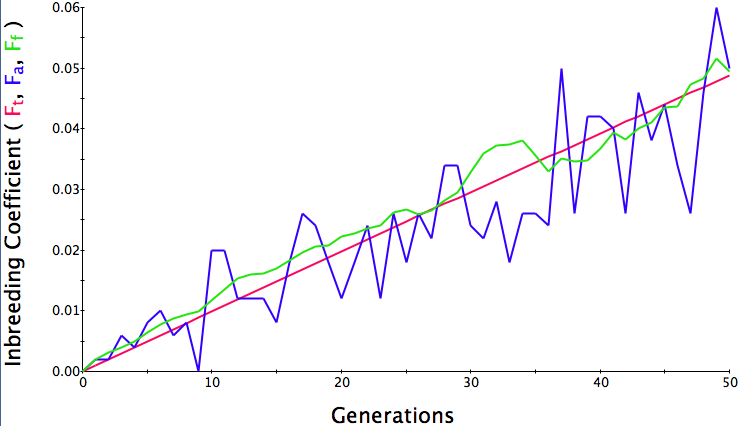
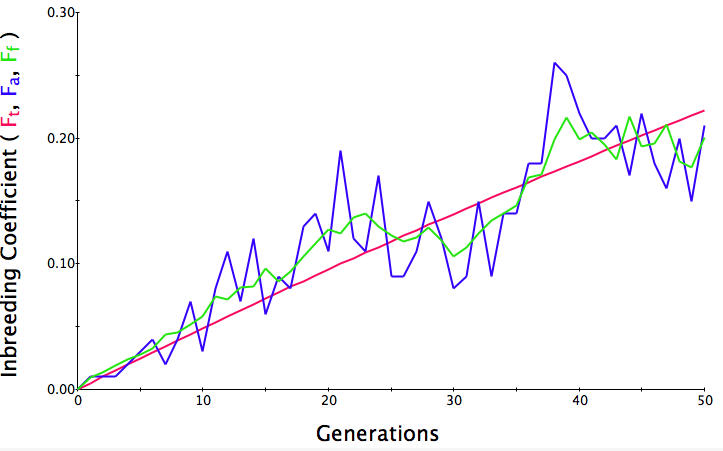
In the first graph below, the population size is 500, the initial level of inbreeding is F = 0, and the simulation is run for 50 generations. The red line is the predicted level of inbreeding if the population is breeding randomly. The blue and green lines are the "actual" individual and population average inbreeding. You can see that the red line is straight and at 50 generations, the predicted level of inbreeding is F = 0.05 (5%). Over the generations, the actual level of inbreeding is sometimes higher than predicted and sometimes lower, but over time it tracks the prediction fairly well.
Population size = 500
Initial F = 0 COI after 50 generations = 0.06 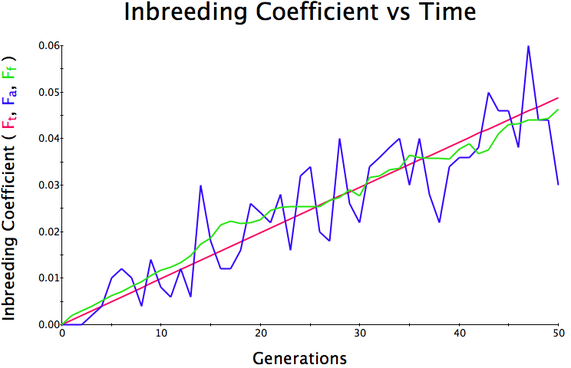
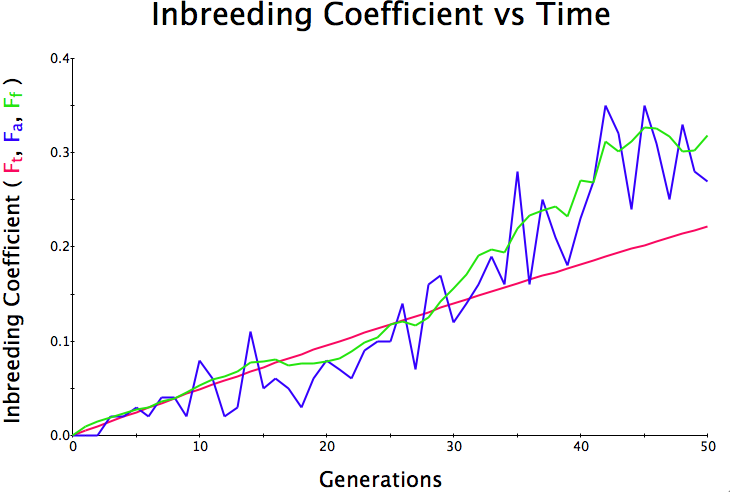
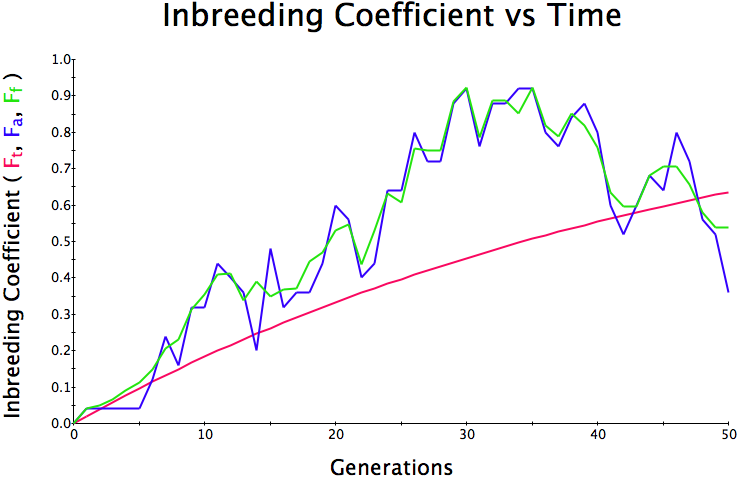
Population size = 100 Initial F = 0 COI after 50 generations = 0.23 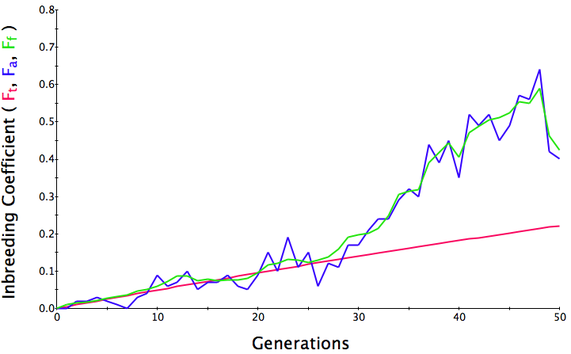
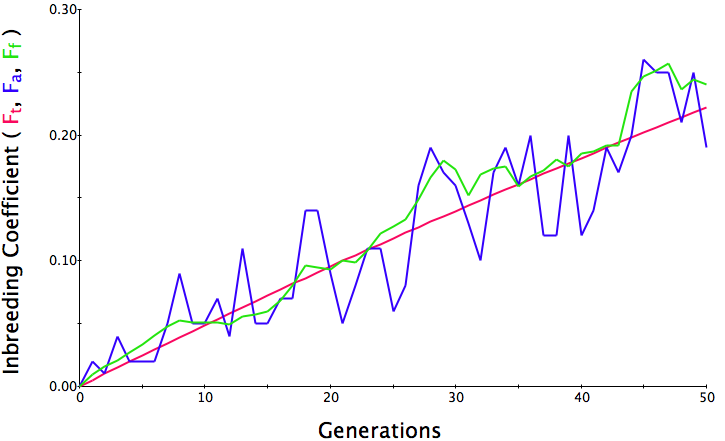
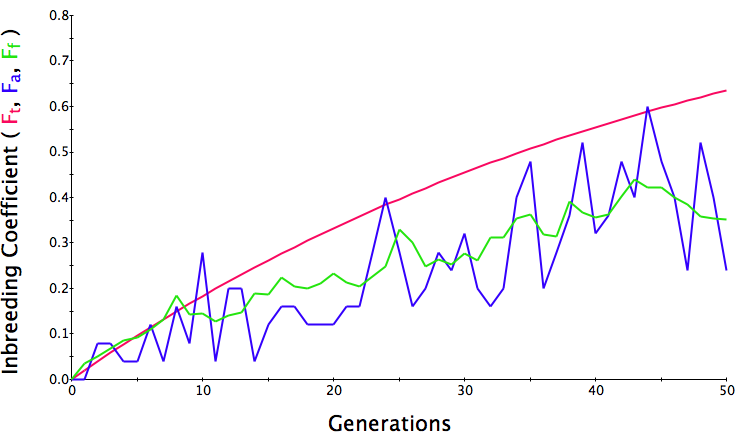
Population size = 50 Initial F = 0 COI after 50 generations = 0.38 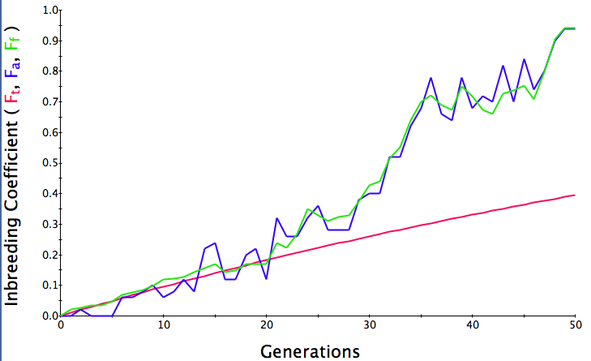
|
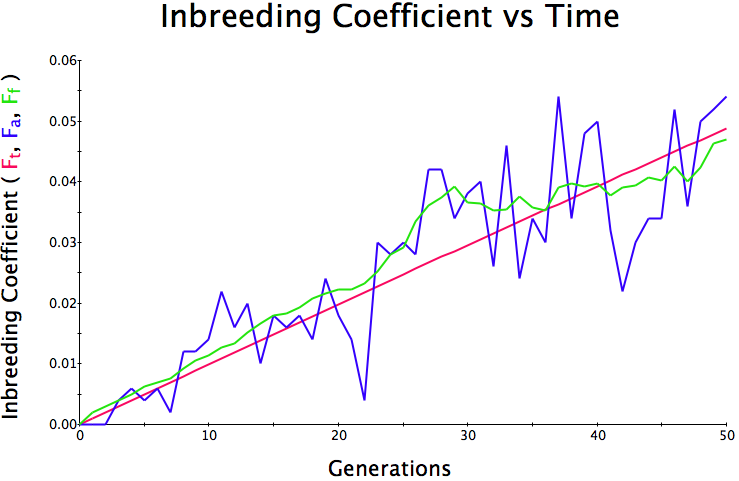
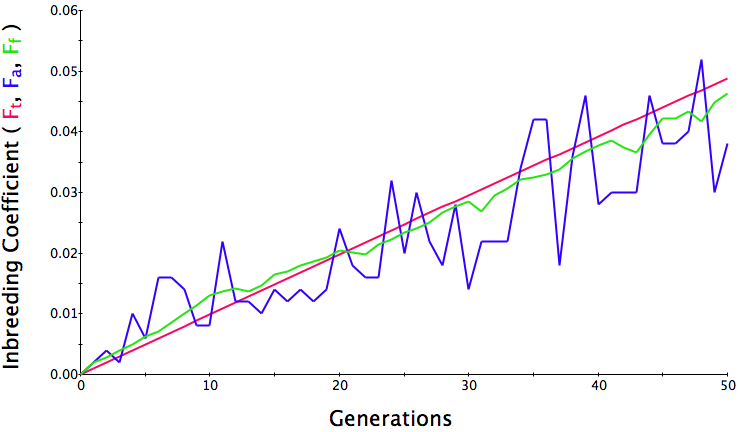
Below are three sets of simulations with population sizes as above (500, 100, and 50 individuals) so you can see how the population responds in each simulation is different even though the parameters remain the same. Initial level of inbreeding is zero as above, and all graphs are run for 50 generations. Notice that the y-axis is rescaled in each graph, but for each population size, the final level of inbreeding (the end of the red line) is the always the same.
|
Population size = 500
Initial F = 0 |
Population size = 100
Initial F = 0 |
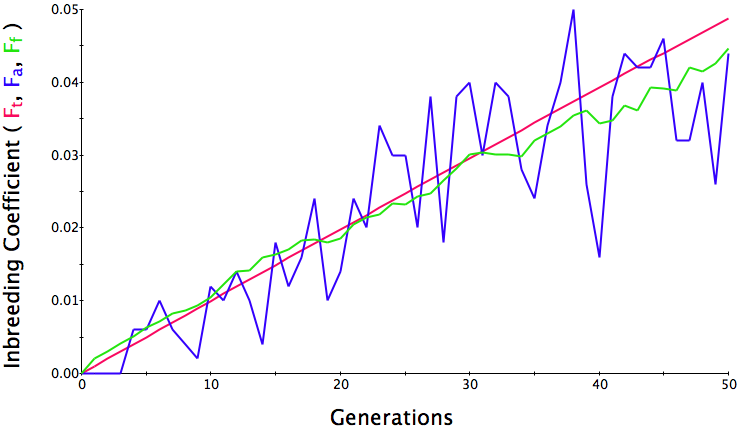
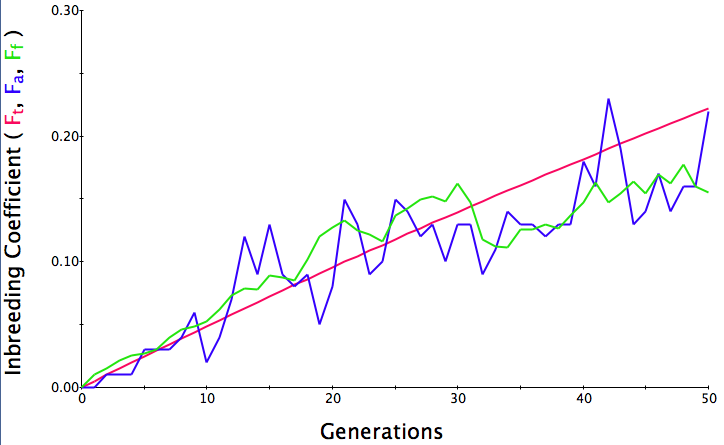
Population size = 50
Initial F = 0 |
|
|
|
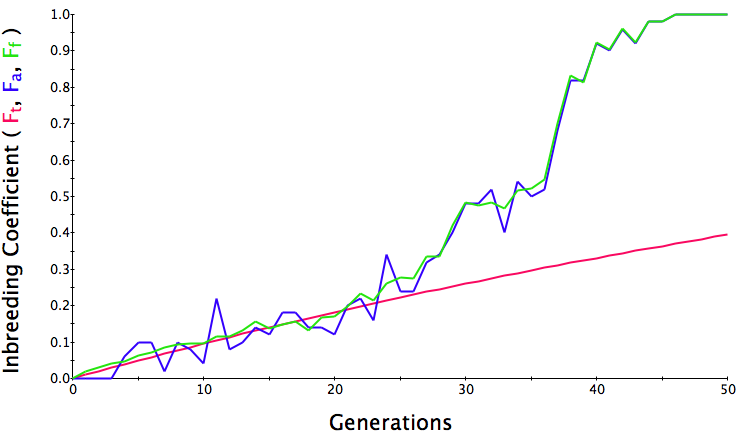
What you will notice is that as the population of breeding animals gets smaller, the genetics become more unstable. With a population size of 50, the population level of inbreeding can swing wildly, and in one population the level of inbreeding actually doesn't increase much (remember, just by chance) while in another the population became completely inbred and F = 1; i.e., the entire population are clones of each other.
When a population is split into multiple smaller ones, the rate of inbreeding in each population will increase proportional to population size. If you separate the Belgian varieties into 4 independent, closed populations, the rate of inbreeding of the Laekenois will increase rapidly and that of the Tervuren the most slowly.
This means that regardless of how carefully you breed, the genetics of the population can be changing just by chance in ways that are very detrimental. And the kicker here is that most populations of purebred dogs are not being randomly bred. In fact, we tend to deliberately breed together dogs that are more closely related than the average of the population, so the rate of increase in inbreeding in our real populations is almost always increasing much faster over the generations than predicted of a randomly breeding population.
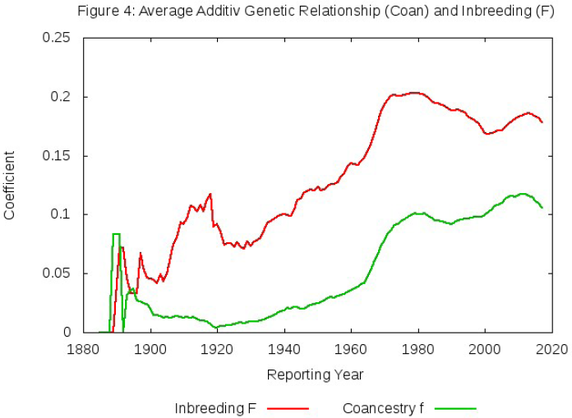
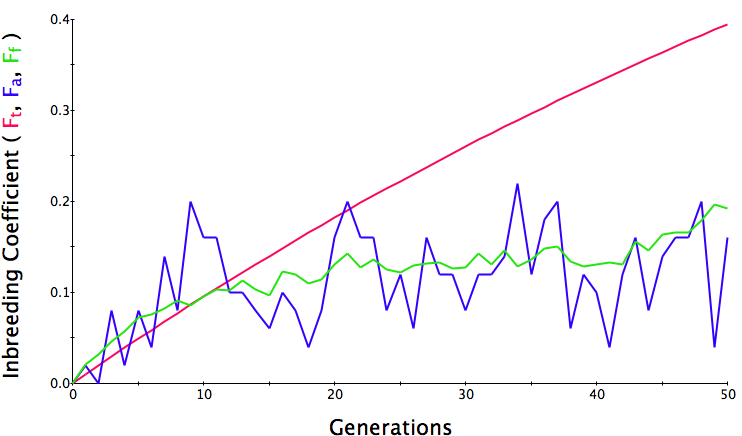
The evidence of this is in the graph below. The green line is the generation-by-generation level of inbreeding predicted if the animals were randomly breeding. (It's not a straight line because it uses the actual number of dogs and their inbreeding to predict the next generation and not a simulated population.)
The red line is the actual inbreeding observed in the population. This graphs says that if the average inbreeding of the population is ALWAYS much higher than predicted if the animals were randomly bred. Over the last century, breeders could have done a much better job of controlling the rate of inbreeding, but instead they selected breeding pairs that were closely related.
The red line is the actual inbreeding observed in the population. This graphs says that if the average inbreeding of the population is ALWAYS much higher than predicted if the animals were randomly bred. Over the last century, breeders could have done a much better job of controlling the rate of inbreeding, but instead they selected breeding pairs that were closely related.