|
This is a preliminary analysis from an incomplete pedigree database. More coming soon...
POPULATION INFO FROM PEDiGREE DATA
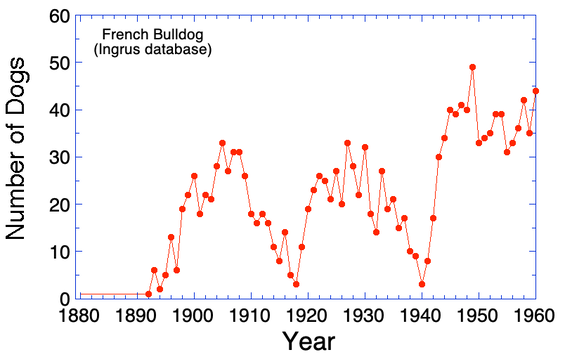
Data from the Ingrus.net online pedigree database (the only database I have at this point), which is very incomplete. Consequently, these analyses are very preliminary.
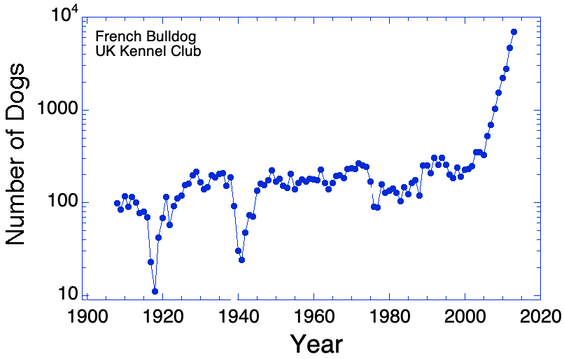
Numbers appear to have declined steeply around WWI and WWII. If this was just failure to register dogs during these periods, we would expect the numbers to recover immediately post-war. Instead, they increase gradually over the next decade, which suggests that there was an actual population crash during the wars.
REGISTRATION DATA
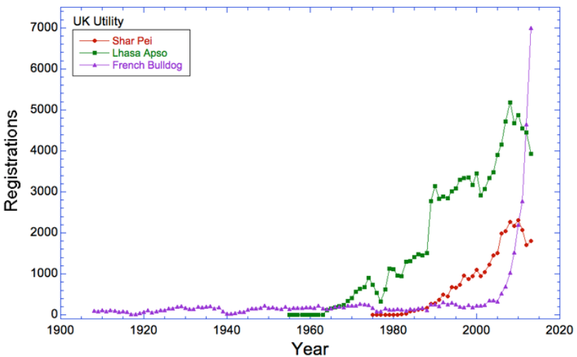
These data are from registration records from the UK Kennel Club. The popularity of the Frenchie has exploded in the last 10 years. In the UK, the number of registrations is increasing yearly at an astonishing rate (see the graph below), and in the US the Frenchie is fourth behind the Labrador, Golden Retriever, and German Shepherd.
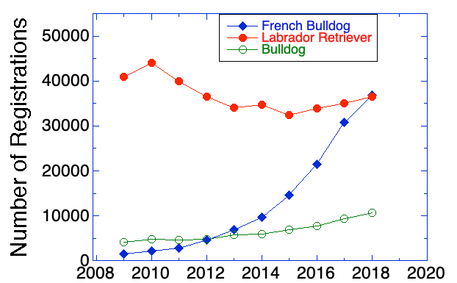
Data for the last decade
The data in the graph above go to about 2015. This graph goes to 2018. Note that registrations have gone from about 500/yr in 2000 (graph above), to nearly 40,000 (!!!) in 2018.
The data in the graph above go to about 2015. This graph goes to 2018. Note that registrations have gone from about 500/yr in 2000 (graph above), to nearly 40,000 (!!!) in 2018.
The UK Kennel Club registration data, plotted on a logged y-axis. Effects of WWI and WWII are obvious.
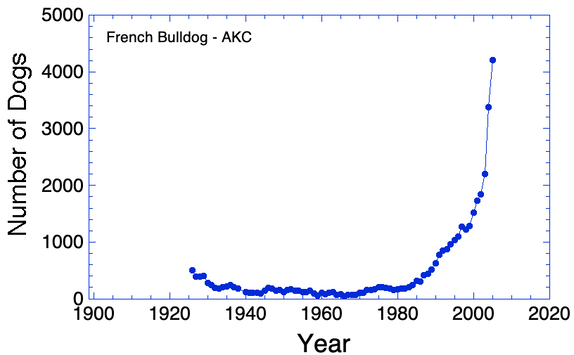
AKC Registrations (to about 2005)
Wishing we had more recent data...
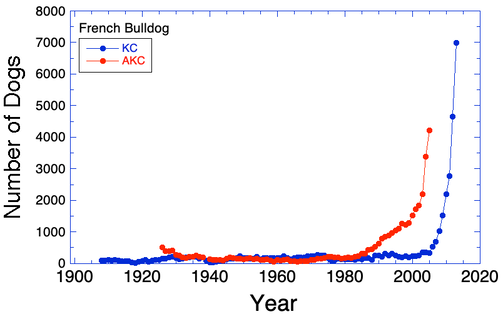
AKC vs KC Registrations
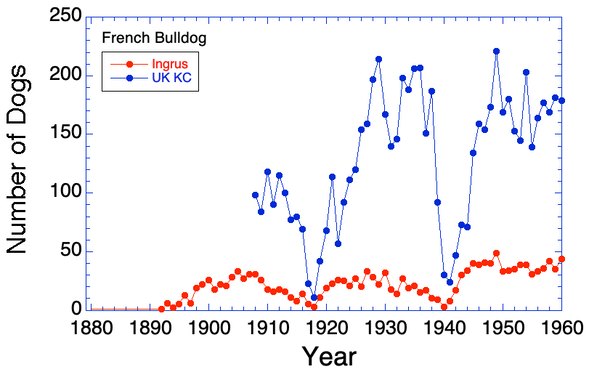
UK KC Registrations, together with Ingrus public database
This shows that only a fraction of the registered UK population is recorded in the Ingrus database, so we need better data!
This shows that only a fraction of the registered UK population is recorded in the Ingrus database, so we need better data!
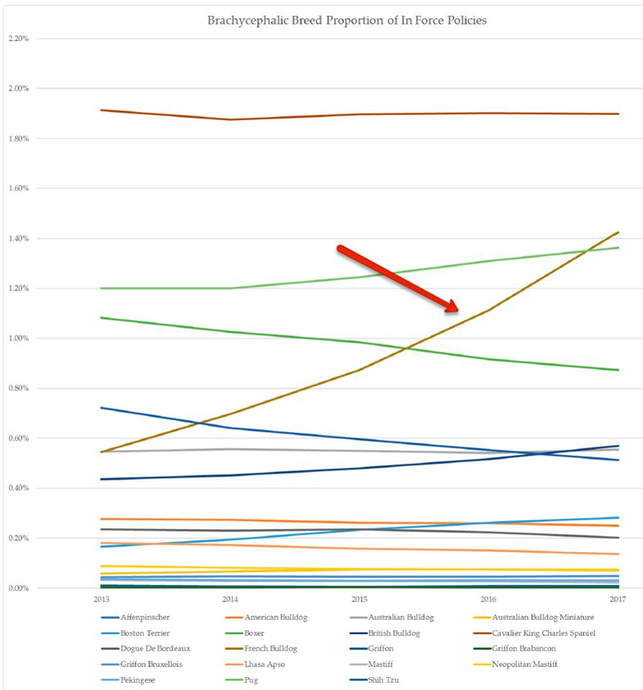
Australia (2013-2017)
Data for Australian breeds from insurance data. (Fawcett et al 2019)
French Bulldog is the red arrow.
Data for Australian breeds from insurance data. (Fawcett et al 2019)
French Bulldog is the red arrow.
LIFESPAN
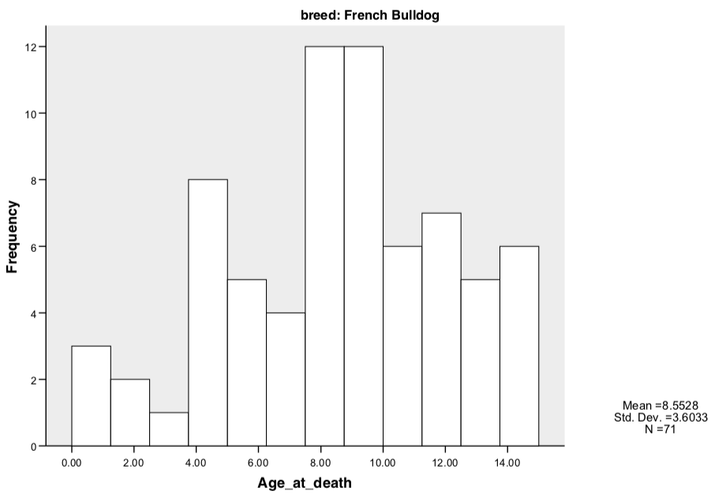
(UK Kennel Club data, 2004)
(UK Kennel Club data, 2004)
Median lifespan (link)
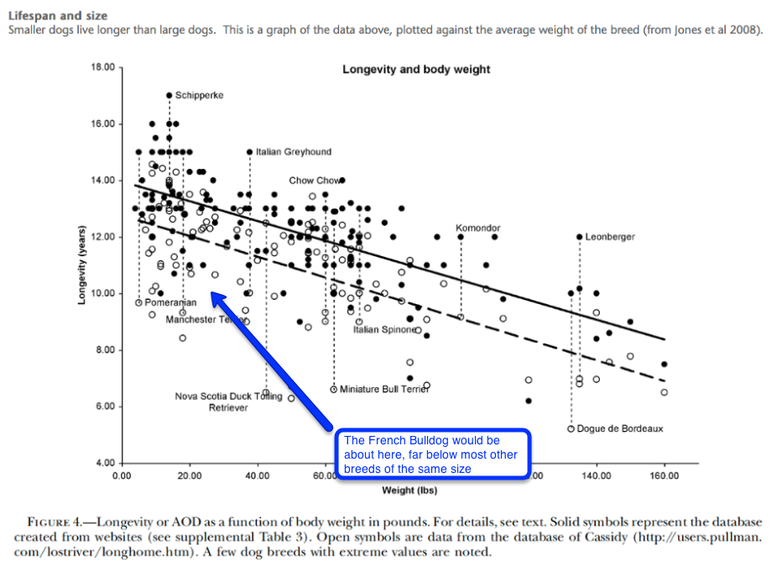
The average lifespan of a Frenchie in these data is about 10 years, on the low end of the distribution for dogs. From the second graph below, a 25 pound dog should live to about 13.
The average lifespan of a Frenchie in these data is about 10 years, on the low end of the distribution for dogs. From the second graph below, a 25 pound dog should live to about 13.
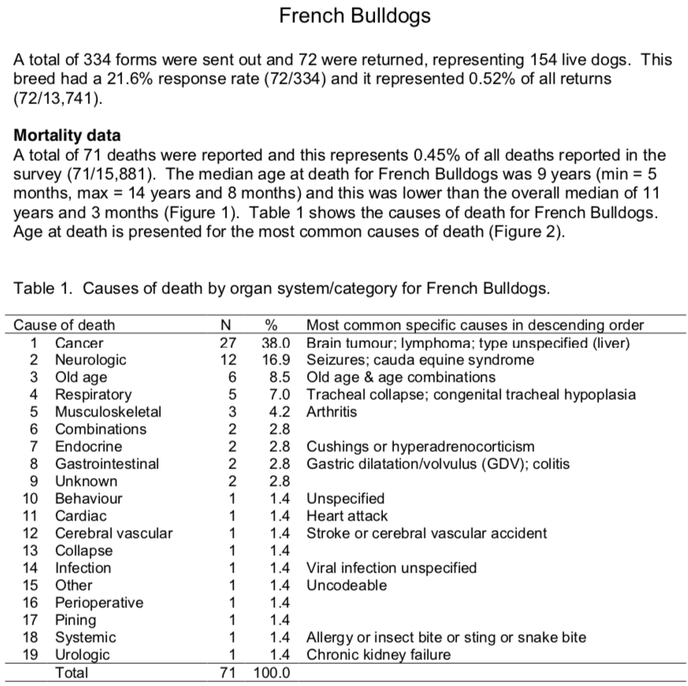
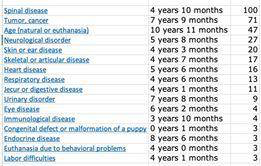
Cause of Death
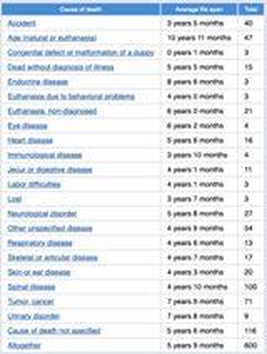
(UK Kennel Club health survery, 2004)
(UK Kennel Club health survery, 2004)
INBREEDING
Genomic inbreeding (from DNA)
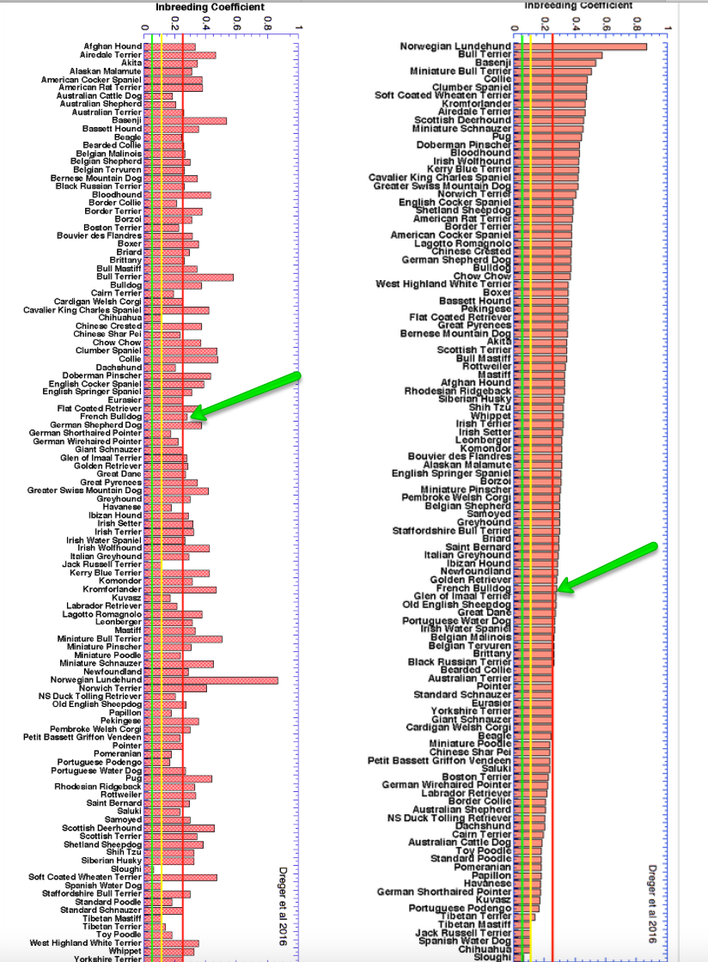
These are data on inbreeding coefficient determined from DNA analysis of SNP data from Elaine Ostrander's lab at NIH. You can read my blog post about this study HERE.
Frenchies are at the green arrow. Breeds are in alphabetical order on the left and by rank on the right.
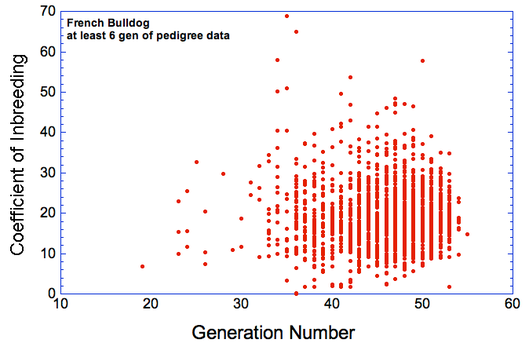
Average inbreeding in Frenchies in these data is close to 30%. A sib-sib cross produces inbreeding of 25%. So these data indicate that the average breeding is the genetic equivalent of a full-sibling cross. Inbreeding of most purebred dogs is greater than 25%, as you can see in the graph on the right. A population producing mostly healthy animals would have inbreeding of about 5% or less; in conservation genetics, inbreeding of more than about 10% is expected to result in enough genetic disease and loss of health that the population will eventually go extinct. In the graph at the bottom of the page of data from an incomplete pedigree database, there are many dogs > 30%, and some dogs as high as 70% (!!!). Because the database is incomplete, these numbers will be underestimates.
Pedigree inbreeding (from pedigree data analysis)
The pedigree data are from the World Pedigree database, up to about 2010 (about generation 55). It is very incomplete, so when the coefficient of inbreeding is calculated the values will be UNDERESTIMATES.
The plot below is for dogs with at least 6 generations of pedigree information. These values will be underestimates of the true values.
For comparison, the coefficient of inbreeding of a dog from a half-sib x half-sib cross is 12.5%; from a sib x sib cross the inbreeding is 25%. It's clear from the second graph that most of the dogs with a decent number of pedigree generations are higher than 10%.
HOMOZYGOSITY
Inbreeding produces homozygosity. DNA analysis can identify regions of homozygosity on the chromosomes, and they can be mapped for visualization.
These are data for 27 French Bulldogs; each row is a dog. Across the top, the scale shows the chromosomes 1 to 38, linked end-to-end.
Pink is heterozygous, blue is homozygous. Vertical "stripes" of blue indicate areas on a chromosome where most individuals are homozygous (e.g., fixed for those alleles).
More blue in larger blocks indicates higher inbreeding. For more info about these types of pictures, go to -
https://www.instituteofcaninebiology.org/blog/a-dna-primer-for-dog-breeders-genetic-diversity-inbreeding-roh
Breeding together two dogs that are homozygous at the same loci will produce offspring that are all homozygous at those loci.
GENETIC DIVERSITY
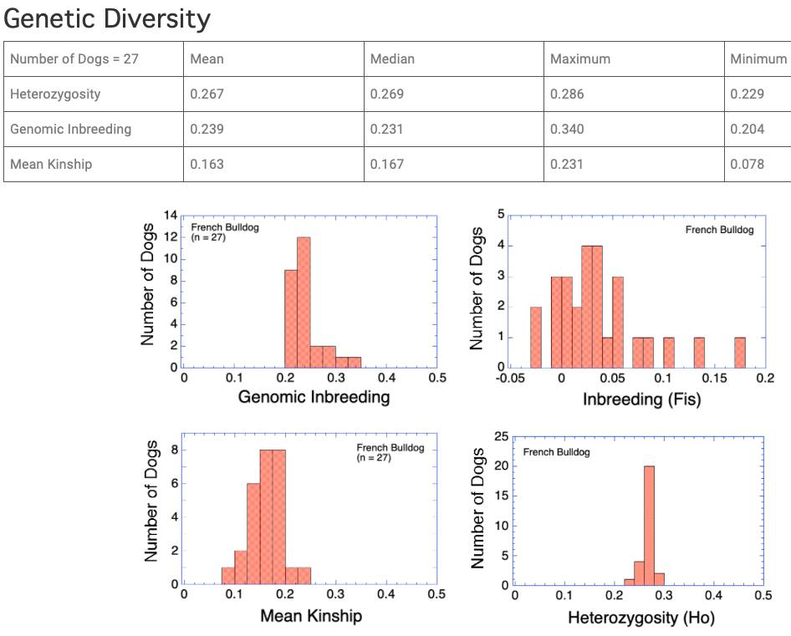
These are data from DNA analysis for 27 anonymous dogs from a research study (the same ones as in the Homozygosity graph above). Data are for inbreeding coefficient from DNA ("genomic COI), inbreeding (as Fis), kinship coefficient, and heterozygosity.
Inbreeding coefficient is the fraction of loci that are identical by descent (i.e., both alleles inherited from the same ancestor).
Inbreeding (Fis) is a population measure of inbreeding. If the population is breeding randomly, Fis will average 0. Breeding dogs more closely related than average produces Fis >0; breeding dogs less related than average produces Fis <0. This graph shows that breeders are preferentially inbreeding (in this particular sample of dogs).
Kinship coefficient is a measure of genetic similarity. The inbreeding coefficient of a dog is equal to the KC of its parents; similarly, the KC of two dogs is the predicted COI of their litter. If the population is breeding randomly, COI and KC distributions should be about the same. If COI is higher than KC, that means breeders are preferentially inbreeding; i.e. there are less related dogs they could have bred to that would produce lower inbreeding in the offspring. This is consistent with the graph for Fis.
Heterozygosity is a measure of the genetic diversity in that it is the fraction of loci that are heterozygous (i.e., not homozygous).
MORE ON GENETIC DIVERSITY
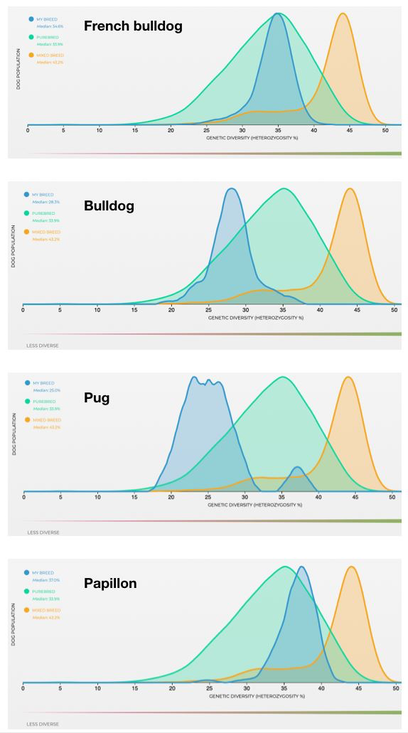
These are data from MyDogDNA (Finland), that include animals from around the world, including lots US dogs. I have included the charts for a few other breeds for comparison - Bulldogs, Pugs, and Papillons.
Blue is the breed, orange is data from mixed breed dogs, and green is all the purebred dogs in their database. Lowest genetic diversity is to the left, highest is to the right.
You can see that Frenchies about in the middle of the distribution for all breeds, and much better off than Bulldogs and most Pugs, and a bit lower than papillons.
HEALTH
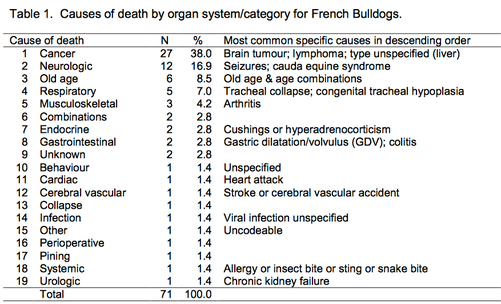
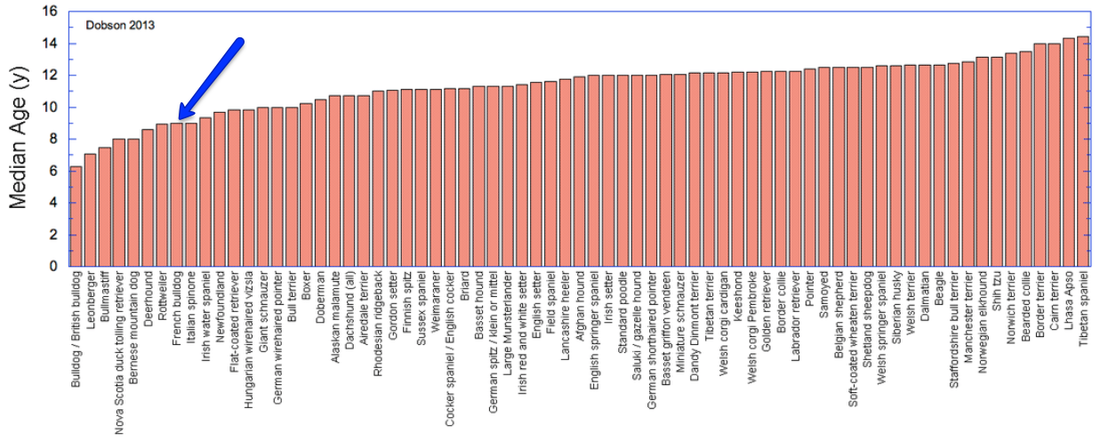
The most common cause of death is Cancer (table), which is first diagnosed in animals of about 10 yrs old (graph). The table and first two graphs are data from the UK. After these are data from the Finnish Kennel club.
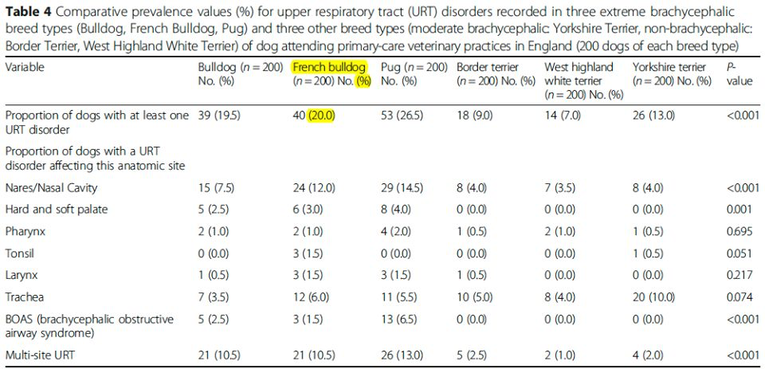
Incidence of upper airway issues in brachy and non-brachy breeds.
Bulldog: 19.5%
French Bulldog: 20.0%
Pug: 26.5%
From the paper by O'Neil cited above (Epidemiological associations between brachycephaly...)
Bulldog: 19.5%
French Bulldog: 20.0%
Pug: 26.5%
From the paper by O'Neil cited above (Epidemiological associations between brachycephaly...)
(data from MyDogDNA, May 2019)
Canine Multifocal Retinopathy 1, (CMR1)
* carriers - 11.21%
* at risk - < 1%
Degenerative Myelopathy, (DM; SOD1A)
* carriers = 31.59%
* at risk = 4.83%
Robinow-like syndrome, (DLV2)
* carriers = 0%
* at risk (homozygous) = 100% (i.e., mutation appears to be fixed in breed)
---------------
Nostril stenosis (Liu et al 2017; 214 dogs)
Open: 10.8%
Mild: 13.6%
Moderate: 29.0%
Severe: 45.33%
BOAS Functional Grade (Liu et al 2017)
Grade 0: 10.7%
Grade I: 30.4%
Grade II: 43.5%
Grade III: 15.4%
Nostril stenosis (Liu et al 2017; 214 dogs)
Open: 10.8%
Mild: 13.6%
Moderate: 29.0%
Severe: 45.33%
BOAS Functional Grade (Liu et al 2017)
Grade 0: 10.7%
Grade I: 30.4%
Grade II: 43.5%
Grade III: 15.4%
CANCER
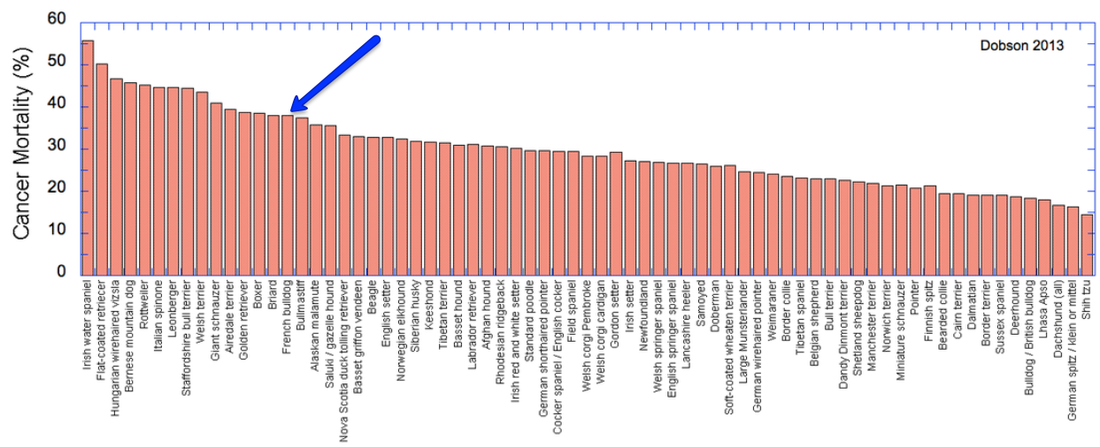
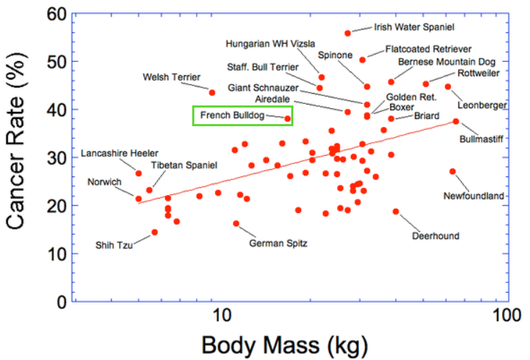
The French Bulldog's mortality from cancer is right up there with the breeds that are notorious for high rates of cancer.
The median age of death from cancer is only about 9, so it is not necessarily an "old age" cancer. Only 8% of dogs die of old age, and cancer, together with epilepsy, appears to be a major factor in reducing lifespan below that expected for a similar sized dog.
Frenchies vs other breeds
In dogs, cancer rate scales with body mass - bigger dogs have more cancer. As in the graph above, the French Bulldog has a much higher incidence of cancer than other breeds of similar size.
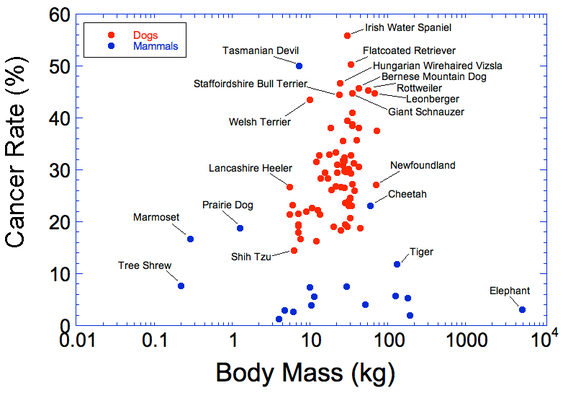
Dogs vs other mammals
But notice that cancer rates of ALL purebred dog breeds are extraordinarily high compared to other animals. In non-pedigreed working dogs, such as the large livestock guarding breeds, lifespan is much longer. Tibetan mastiffs, Bankhar, and other breeds live to 15 years and more, without veterinary care.
HIP DYSPLASIA
Hip dysplasia in Frenchies is very high. Data from OFA (April 2014).
Hip dysplasia in Frenchies is very high. Data from OFA (April 2014).
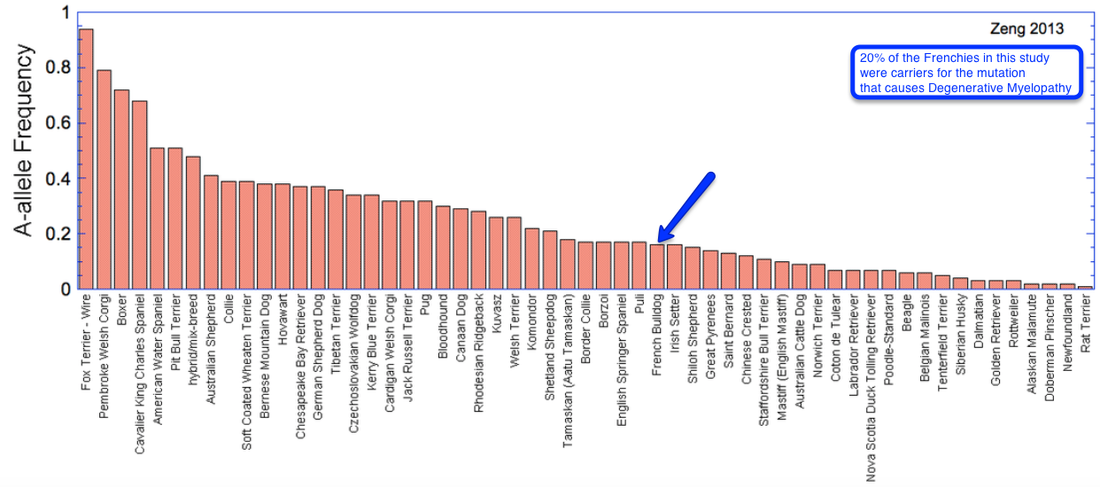
Degenerative Myelopathy
The mutation that causes Degenerative Myelopathy has a frequency of about 20% in the breed. It's much lower than many other breeds, but unless breeders are aware of it, it will only take a couple of popular sires that carry to make things dramatically worse. At this frequency, we would expect to see about 1% affected dogs - not something breeders will likely notice unless they're looking for it. By the time breeders might start to notice (5%? 10% affecteds?), the carrier frequency will be very high and the problem will be extremely difficult to deal with. See this -
http://www.instituteofcaninebiology.org/blog/eliminating-genetic-disorders-in-dogs-too-little-too-late
CAUSE OF DEATH
Data from the Finnish Kennel Club (2000-2019); all cause of death
Age of death (600 dogs)
* Average: 5 years, 9 months
Data from the Finnish Kennel Club (2000-2019); all cause of death
Age of death (600 dogs)
* Average: 5 years, 9 months
Data from the Finnish Kennel Club (2000-2019)
Non-health related causes of death removed (e.g., lost, accident, no diagnosis, etc)
Top 5 health-related cause of death
1) Spinal disease
2) Cancer
3) Age
4) Neurological
5) Skin or ear
Non-health related causes of death removed (e.g., lost, accident, no diagnosis, etc)
Top 5 health-related cause of death
1) Spinal disease
2) Cancer
3) Age
4) Neurological
5) Skin or ear

