PORTUGUESE WATER DOG
(part 2)
This is a PRELIMINARY ANALYSES OF UNEDITED DATABASE. No errors have been removed and the database is incomplete. Incomplete data will result in UNDERESTIMATES of inbreeding and kinship coefficients, and OVERESTIMATES of effective number of founders, founder genome equivalents, and effective number of ancestors. That is, this information is a rosier picture of the breed than reality.
All analyses will need to be redone on a database that is complete, up to date, and free of errors.
All analyses will need to be redone on a database that is complete, up to date, and free of errors.
This is part 2 of analysis of the most recent downloadable PWD pedigree database, which runs through 2014. You can see part 1 here.
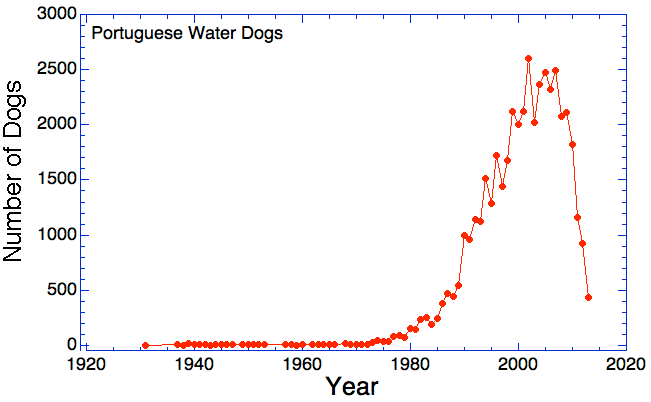
Number of dogs born per year
|
FIGURE 1: Number of dogs in the database by year of birth. The data only go up to 2014.
|
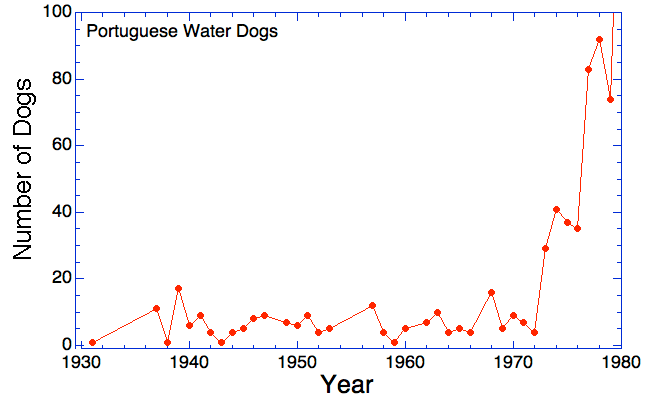
FIGURE 2: Same data as at left, but graphed only to 1980 so you can see early years.
|
|
|
Coefficient of inbreeding
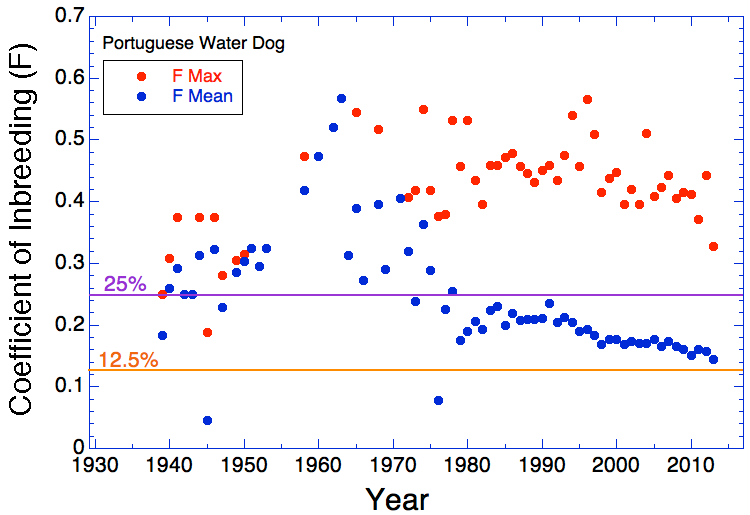
The breeding of two half-siblings results in offspring with a COI of 12.5%.
The breeding of two full siblings (or father x daughter, mother x son) results in offspring with a COI of 25%.
The breeding of two full siblings (or father x daughter, mother x son) results in offspring with a COI of 25%.
|
FIGURE 3: Mean and maximum coefficient of inbreeding (COI) by year of birth. The orange line is COI of 12.5%, which is what is produced by crossing two half-sibs with unrelated parents. The purple line is 25%, which is what you get by crossing two siblings with unrelated parents.
|
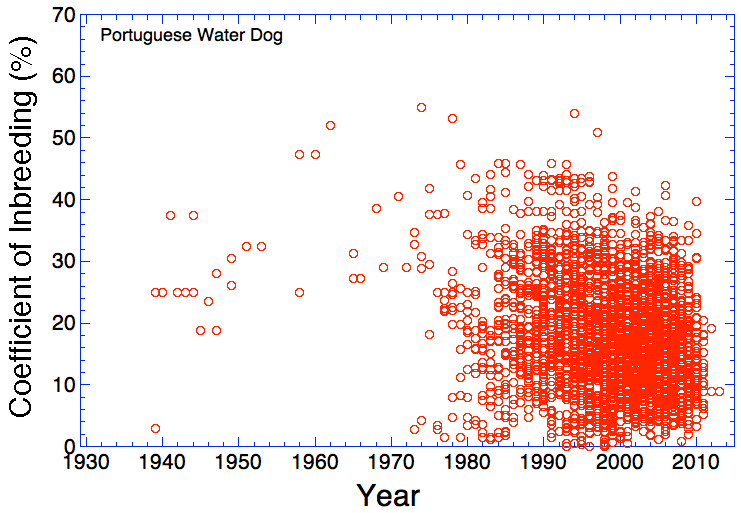
FIGURE 4: Individual inbreeding coefficients by year of birth. The thing that is so striking here is that there was never a time when inbreeding was low. If you look at the charts at the bottom of the page, you will see that the entire breed is originates from just a handful of dogs that were inbred from the start.
|
|
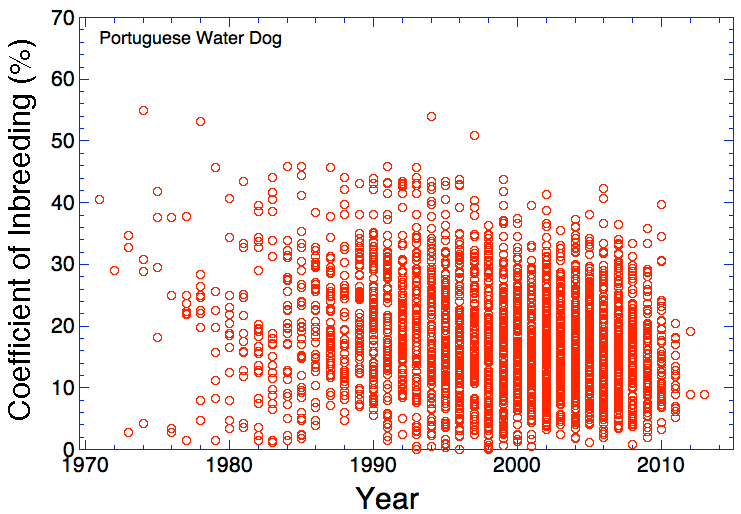
FIGURE 5: Same as Fig 4, except only from 1970-2014. Most dogs produced in the last 10 years have had an inbreeding level higher than produced by a half-sibling cross. It looks like inbreeding is going down in recent decades, but this is because of missing data (see Fig 6).
|
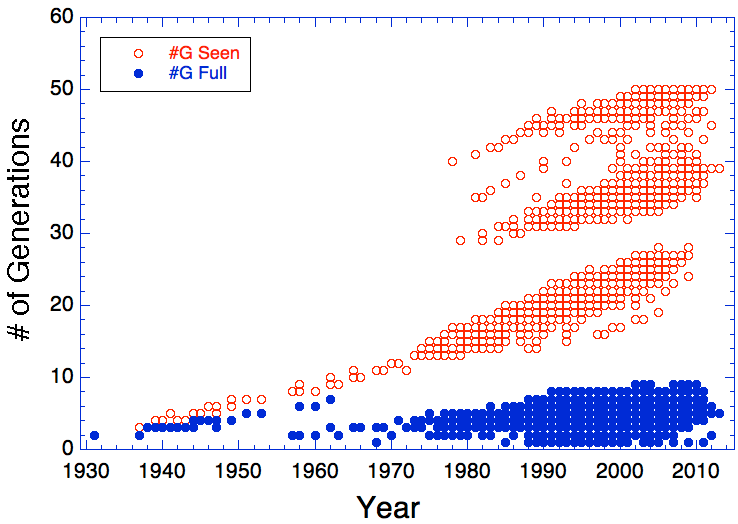
FIGURE 6: In Figure 5, it looks like COI has been going down over the last few decades, but that is not the case because of incomplete pedigrees. Recent missing data will produce the biggest error. Red is the # of generations in the pedigree of the dog, blue is how many of those are complete.
|
Genetic diversity
Founder statistics are in the row just above the data in Table 1. These were computed only using the data up through 1970, because running the more recent years will take much more processing time (I'll do it when I don't need to be using the computer). These data show the genetic situation of the breed over the first 4 generations, and unless new animals are introduced into the studbook, the estimates of genetic diversity will only go down over time. As you can see from the graph at the top, the population explosion after 1970 had a tiny genetic base of only a few dozen animals at best. (Read here about potential effects of population explosions on genetic diversity.)
These parameters will probably be unfamiliar to you. This is the sort of thing that we cover in the ICB population genetics courses.
Definitions of these terms
effective number of founders (fe) = 18.01
founder genome equivalents (fg) = 6.08
effective number of ancestors (fa) = 6.11
average mean kinship (avg mK) = 15.5%
------->
If you were founding a new population of animals, you would want to have at least 50 unrelated animals. The population as of 1970 had the genetics of a population with only 6 founders (fg includes the effects of genetic drift that are not included in fe).
Mean kinship is the relatedness (genetic similarity) of an animal to the other members of the population. An animal with a mean kinship of 12.5% is on average as related as a half-sibling to the other members of the population. The average mean kinship is the average of all of the individual mean kinship values. An average mean kinship of 15.5% indicates that the average level of relatedness among the animals in the population in 1970 is a little higher than that of half-siblings. In a closed population, the degree of relatedness of the animals can only increase over time, so this value will be higher in the current population.
Genetically Influential Ancestors
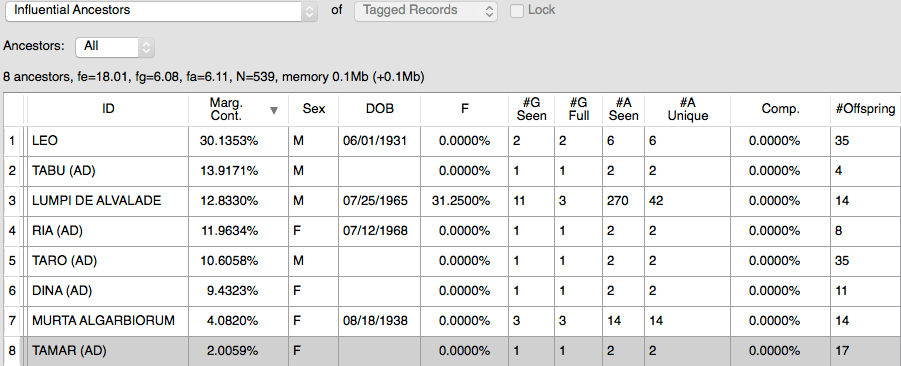
TABLE 1: Ancestor contributions.
Using data from 1931-1970.
This table shows "marginal contribution" of each of the early founders. For example, Leo's genes account for 30% of the genetic diversity in the population through 1970. Tabu's genes account for an additional 13.9% of the diversity, and similarly Lumpi contributes 12.8%.
The top 3 ancestors in this table account for nearly 60% of the diversity in the breed up to 1970.
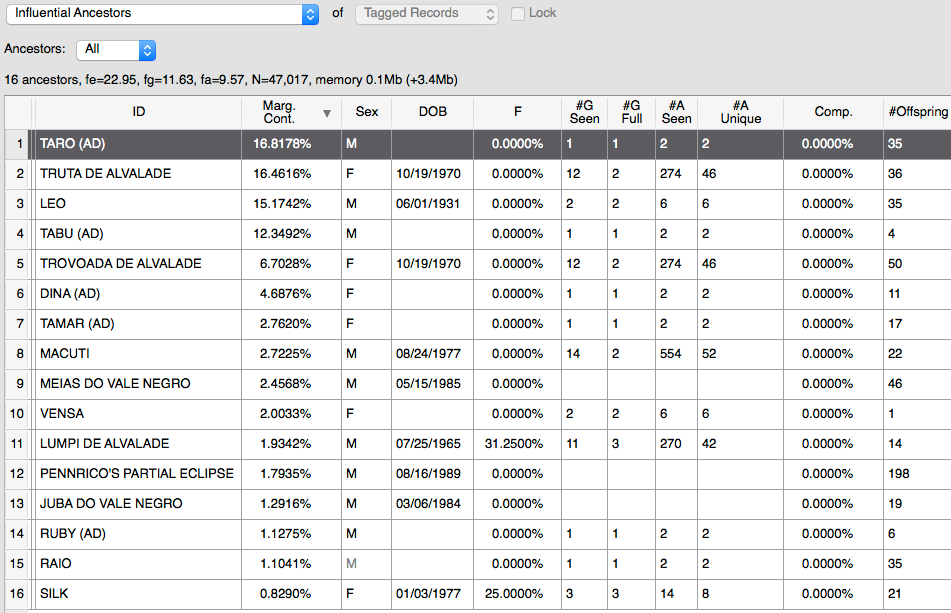
I ran this again using the entire database (1931-2014). You will see that a few things have changed. A few more recent dogs now appear as most influential (note that most had many offspring), but still it is only a handful of dogs that account for most of the genetic variation in the population.
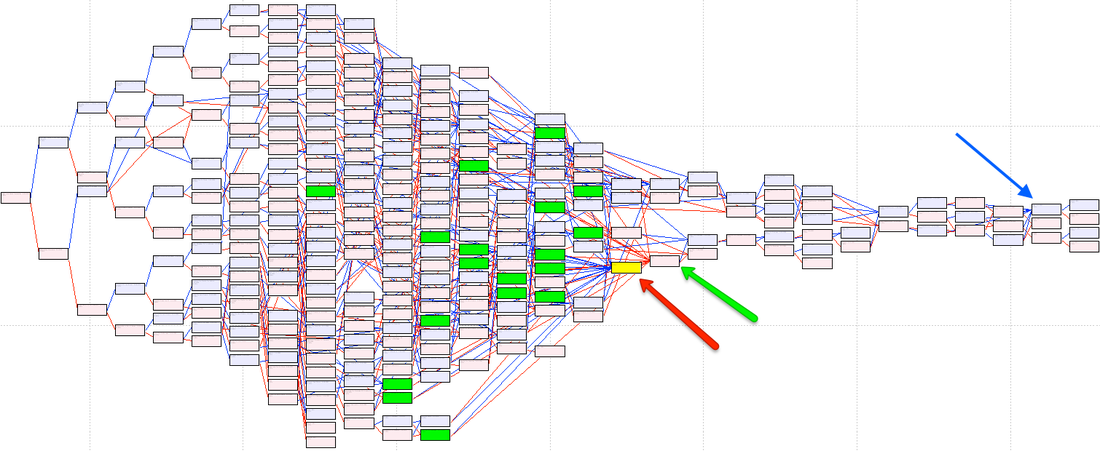
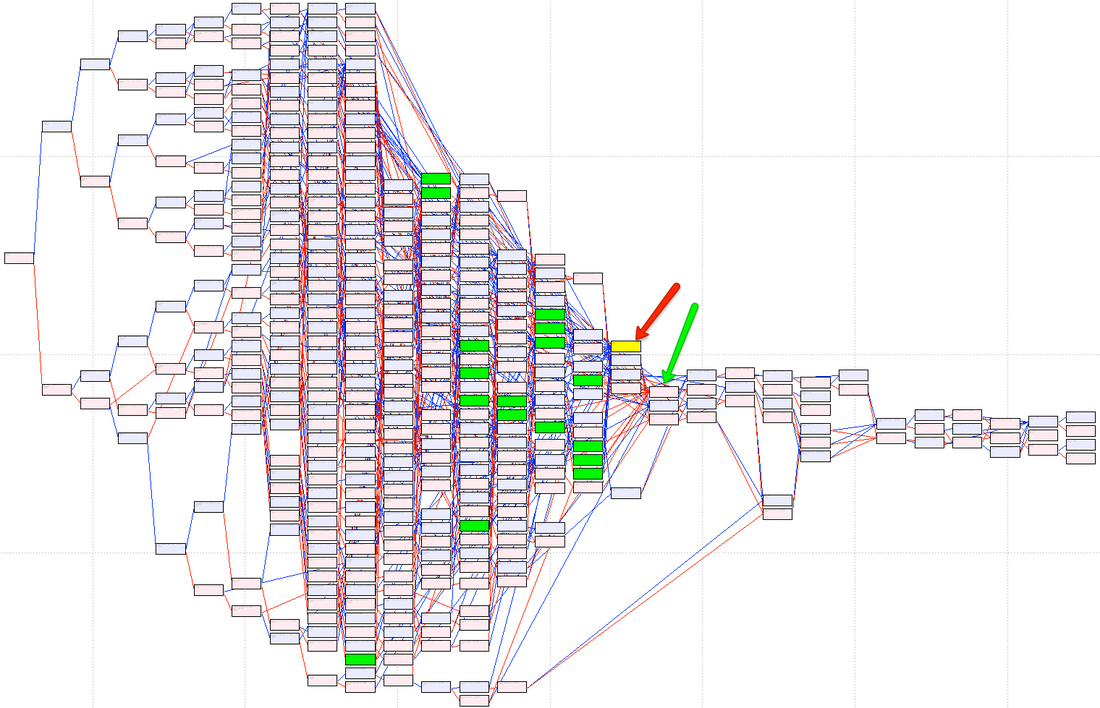
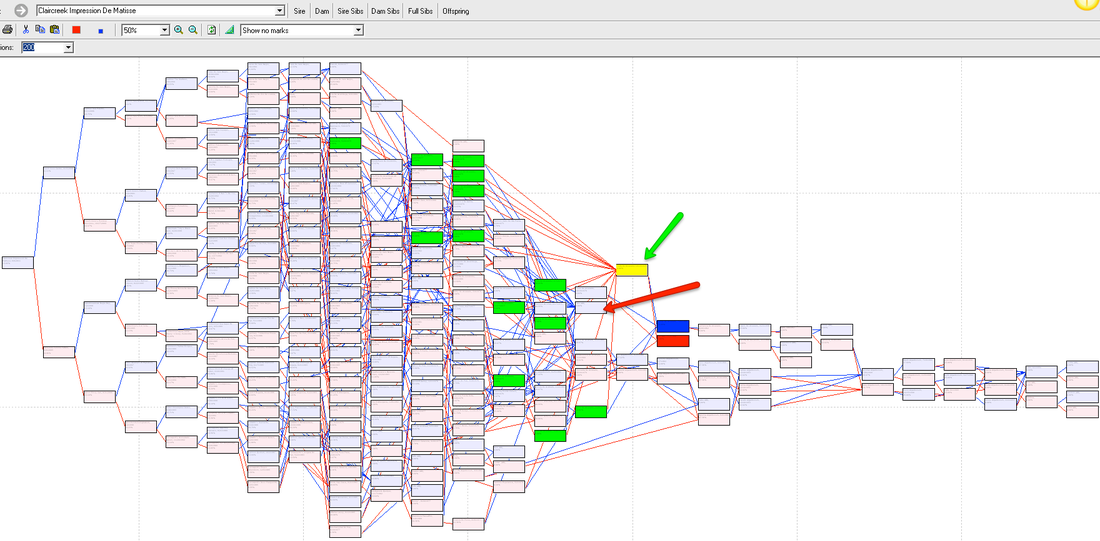
You can see why the first 3 dogs have such a huge influence - they are the red (#1), green (#2), and blue (#3) arrows on this pedigree chart. All the lines coming from the boxes for each dog are offspring. Leo was very early in the pedigree, and the other two dogs were right at the beginning of the increase in numbers. (I forgot to add Leo's arrow to the other graphs, but he's in the same place in all of them.)
Here you can also easily see the tiny genetic base the breed is built upon, and the multiple generations that contained only 3 or 4 dogs. You might want to compare the charts for PWDs with some for other breeds (look under "Projects" on the ICB website).
An essential point to realize is that ALL of the genes you will ever have in this breed came from the founder dogs. All dogs have mutations that can be harmful. You can see that whatever mutations were in the dogs just before the population started growing rapidly, there were may puppies produced that inherited them and they have been carried forward. All the genetic diversity the breed has in the immune system genes were also in the early dogs. If there were only a very few of those, then there will not be much DLA diversity, as over time some is lost and more and more dogs will end up with two copies of the same DLA instead of being heterozygous, which would produce a more robust immune system. The fate of a breed can be sealed early on by these kinds of events. Breeders can't breed away from problems because as you can see, everybody has the same genes.
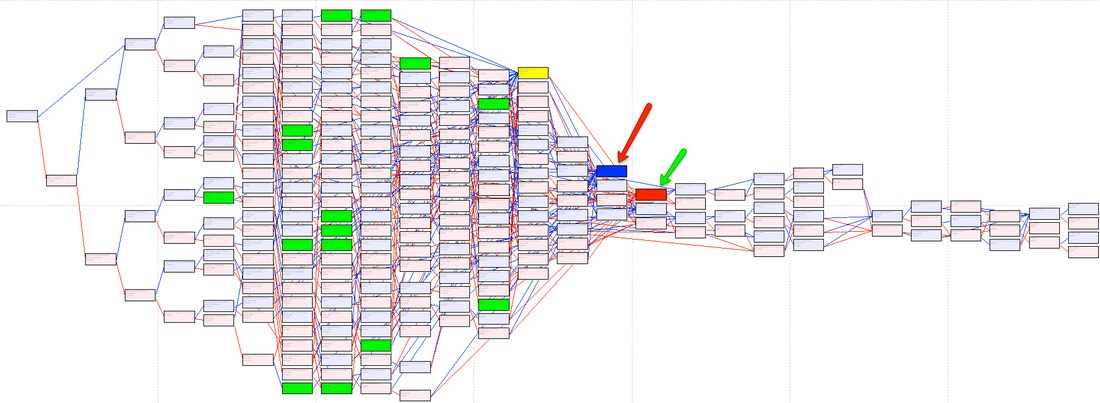
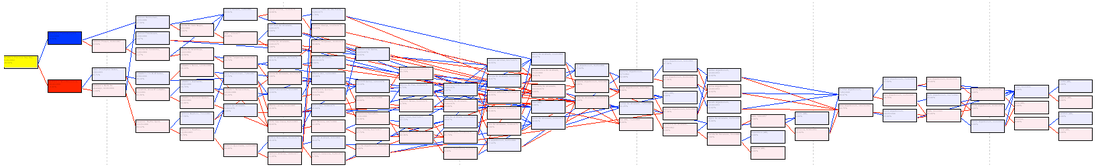
Here's what the pedigree of an dog with inbreeding looks like; long and skinny (COI = 28%). Compare this one to the ones above.
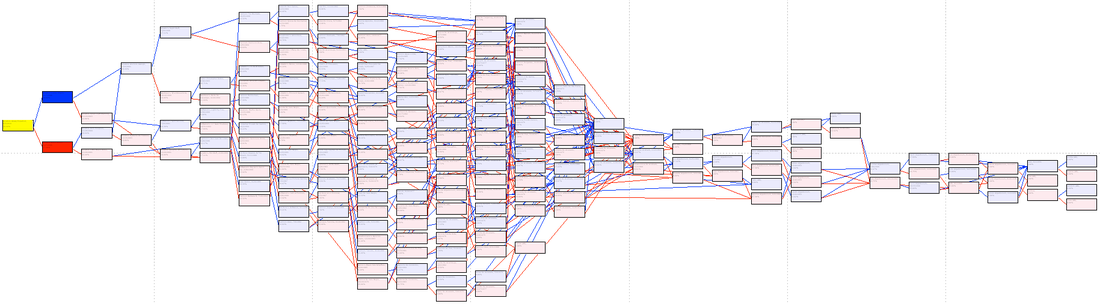
Here's another (COI = 30.9%). A bulge in the middle generations, but then inbreeding in the last few really drove up the COI.
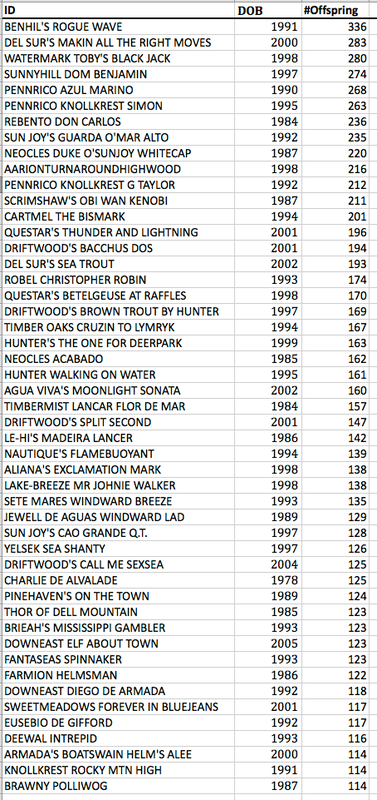
Popular Sires
TABLE 2: All-time most popular (i.e., fecund) sires (through 2014).