BOXER
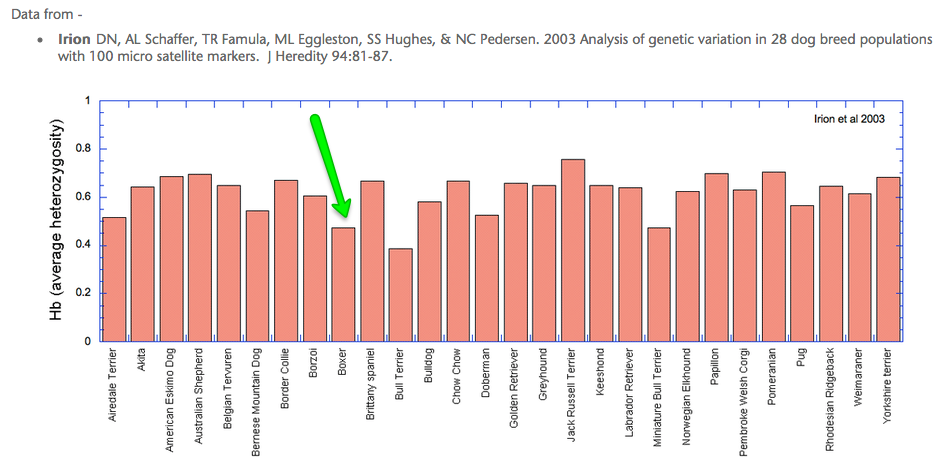
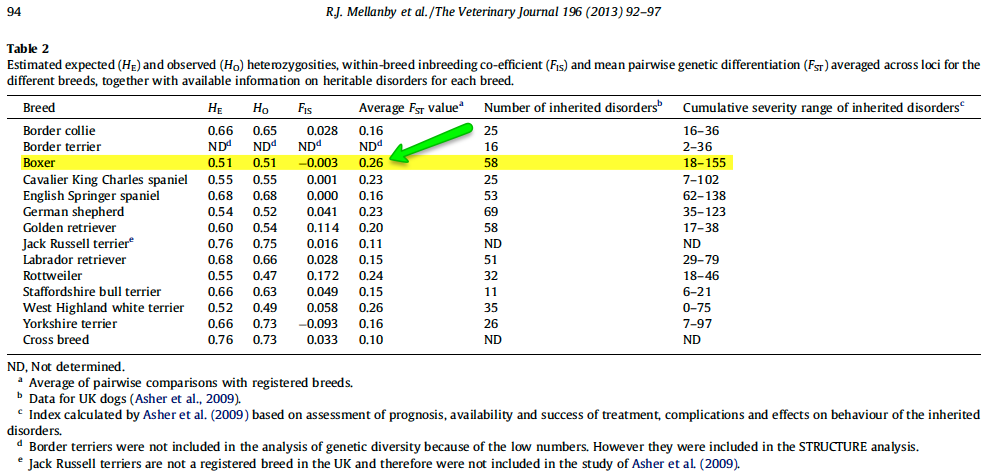
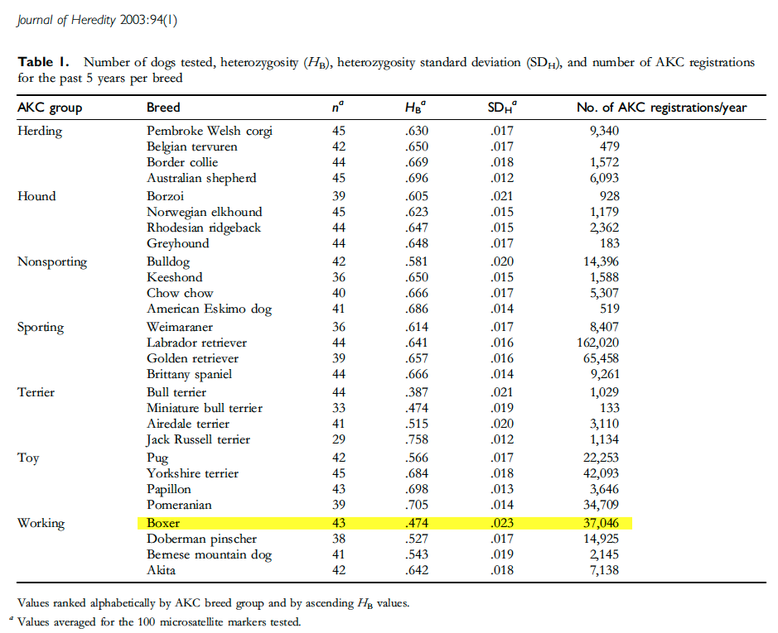
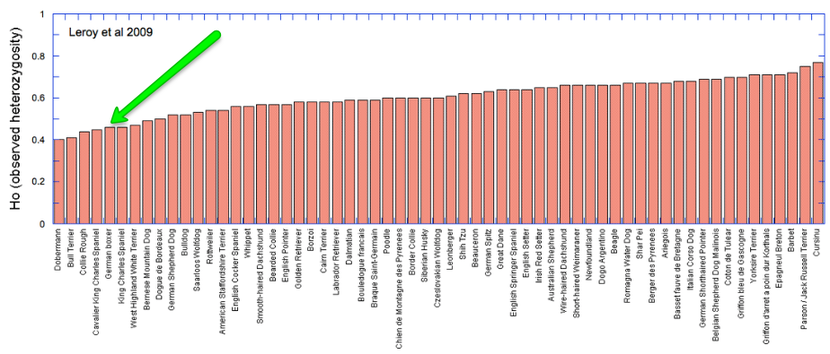
All of these graphs and their sources can be found on the appropriate pages under "Health Data" on the ICB website (and there are larger ones of the ones that are hard to read here). The graphs were drawn from data presented as tables in the published studies.
INBREEDING
Negative values indicate outbred animals (i.e., the homozygosity is less than expected from random breeding); positive values indicate inbreeding (i.e., homozygosity is greater than expected from random breeding). The arrows indicate Boxer and Standard Poodle.
In this study, Fst is inbreeding (lower is better). For comparison, 0.25 (25%) is the inbreeding coefficient of the offspring of full siblings. In the paper they note dogs with inbreeding levels as high as 0.5 (50%).
In this study and the one that follows (graph), heterozygosity is used as an estimate of inbreeding (higher is better).
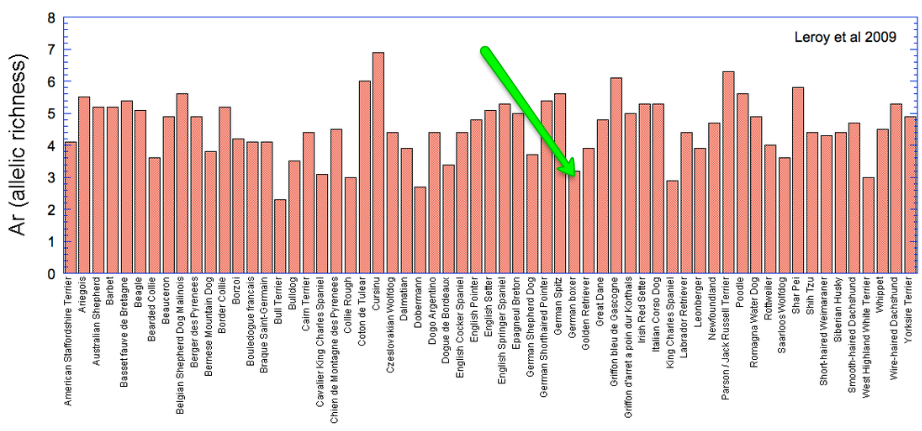
ALLELIC RICHNESS
Allelic richness is a measure of genetic diversity (higher is better).
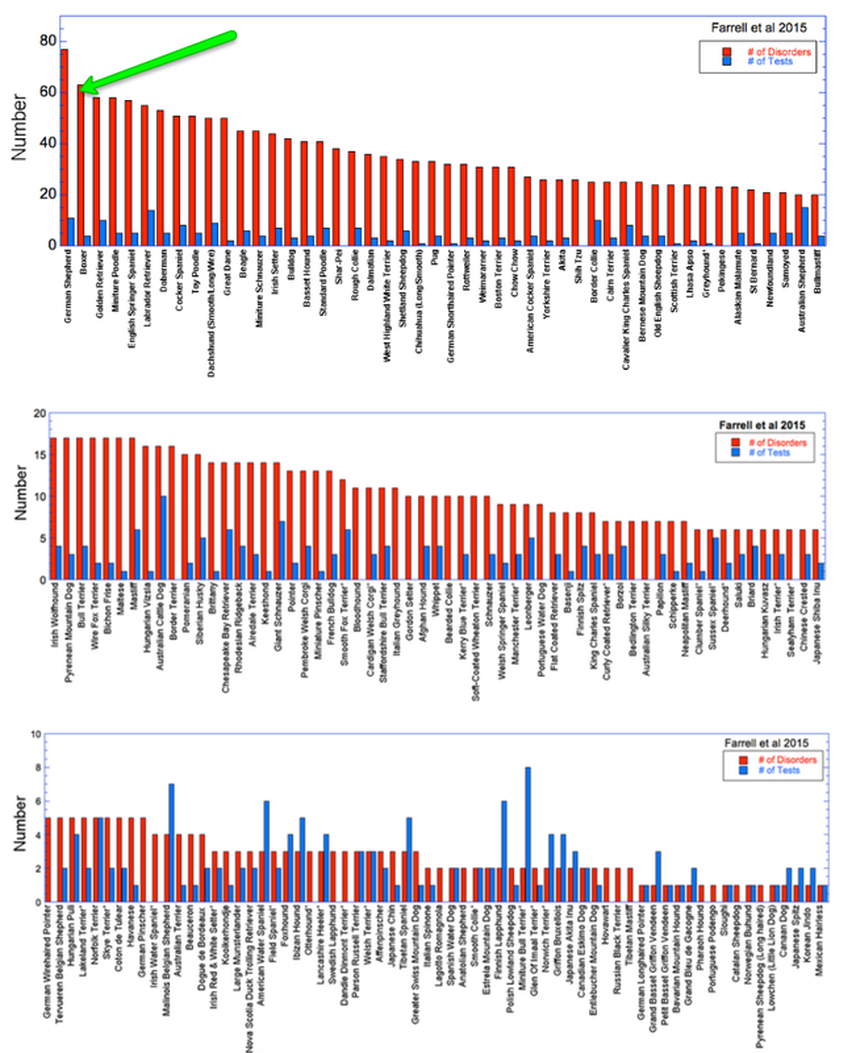
NUMBER OF KNOWN GENETIC DISORDERS
This is a single, very long graph that I have broken into three. Note the y axis scale is different in each (top: 0-85; middle: 0-20; bottom: 0-10)
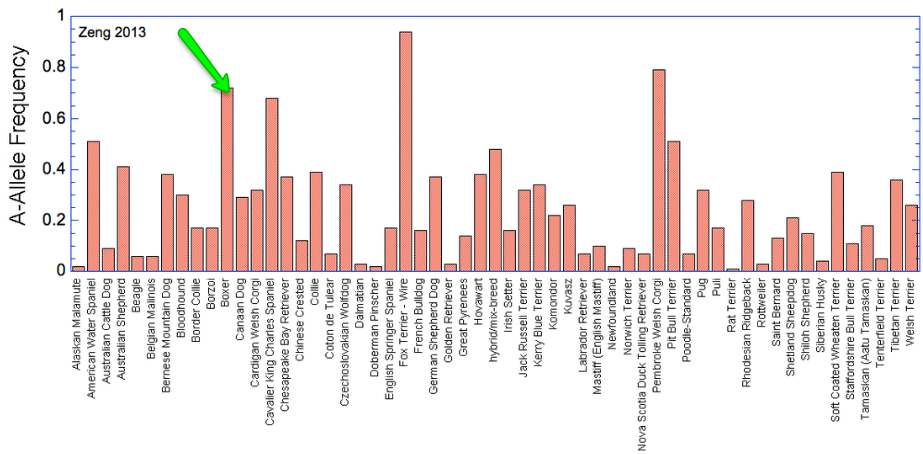
DEGENERATIVE MYELOPATHY
Frequency of the allele associated with DM.
Frequency of the allele associated with DM.
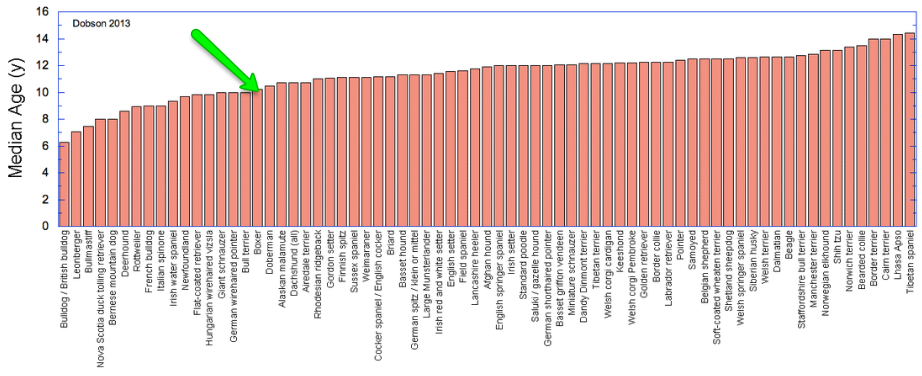
LIFESPAN
These are lifespan data from two different studies.
These are lifespan data from two different studies.
THYROID
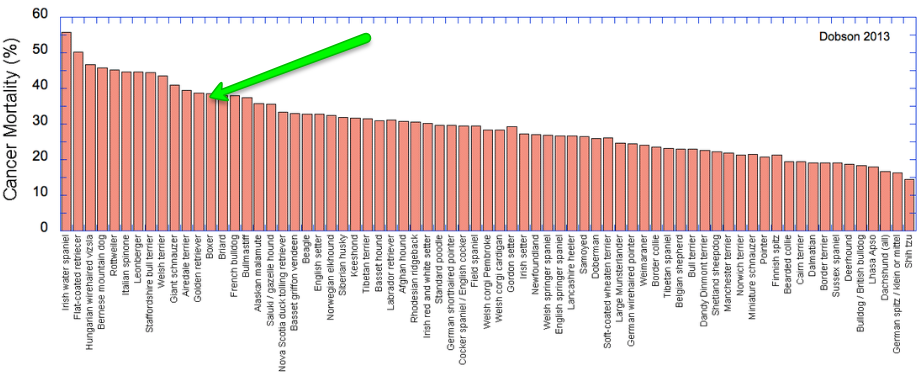
CANCER
Data for mortality from cancer and median age at death from cancer (median means half of the animals live longer, and half of the animals have shorter lives); The significant cancer in Boxers is not during "old age".
