HOW TO READ A DENDROGRAM
A dendrograms is a way to visually describe the relationships between animals (and other things). The word is from the Greek: dendron = tree, and gramma = drawing. It might be an evolutionary tree, or a family history, or the genetic relatedness of members of a group of dogs, which is how we use it.
To give you an idea of the various ways dendrograms can be presented, here is a variety of versions that depict the evolution of the vertebrates. The most primitive (oldest) groups of animals come off the main trunk of the tree first, and as you follow the trunk the more recent (in evolutionary time, or increasing complexity, or whatever) animals come off in sequence. You will notice that sometimes the beginning of the tree is at the bottom, sometimes on the left, and occasionally at the top.
|
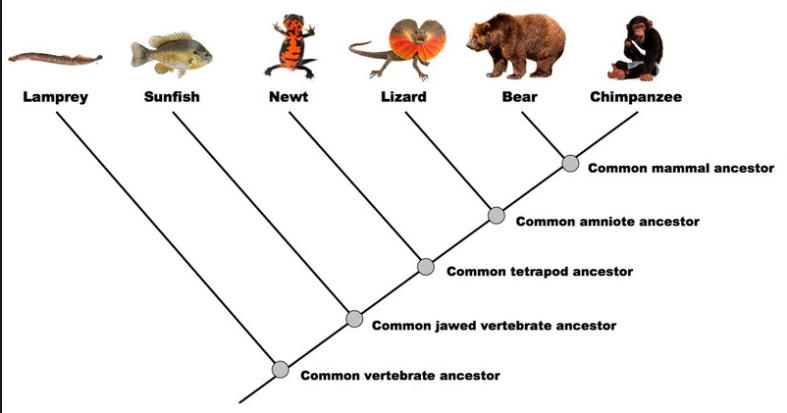
This dendrogram simply indicates the order in which the major vertebrate groups appear, with the most primitive animals first, and the most evolved at the end. This diagram doesn't have a scale for time. It is simply depicting the general relationships between the groups of animals. |
|
|
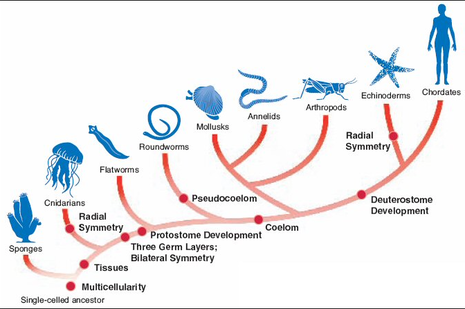
This diagram is similar to the previous one, but here you will notice that one branch has additional branches. This indicates that the mollusks, annelids (worms), and insects are more related to each other than the other groups of animals and that they all came off a secondary branch. |
|
|
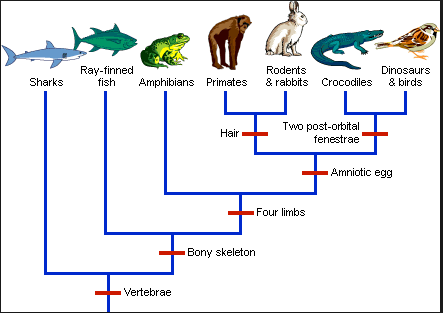
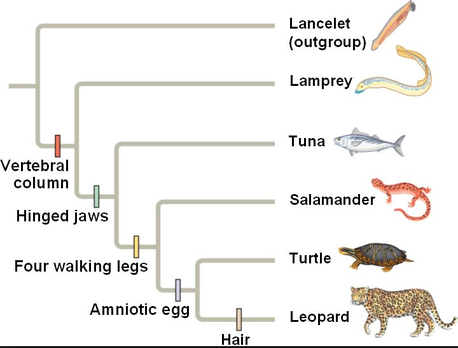
Yet another version of vertebrate evolution. In this one, you can see the evolution of specific traits that were major evolutionary developments marked by the red bars - e.g., first vertebrae, the development of an internal skeleton, four limbs, and the amniotic egg. Notice that the amniotic eff separates two groups - the one containing crocodiles, birds, and dinosaurs, and the other with the mammals (primates, rodents, etc). This indicates that the crocs and birds are more closely related to each other than they are to the mammals. |
|
|
Another version of the one above, using some different animals groups but depicting a similar thing. Notice that this one has the base on the left instead of the bottom.
|
|
|
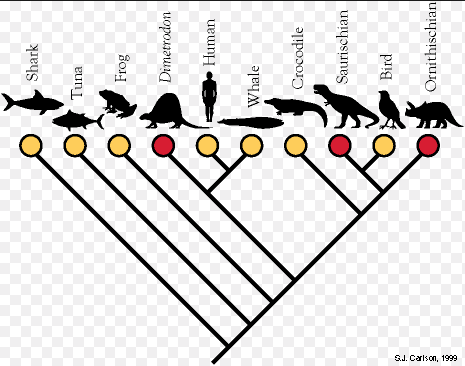
Another version of vertebrates. This one also depicts the crocs, dinosaurs, and birds as coming off separately from the mammals, and it also shows the dinosaur thought to be most closely related to the birds (Saurischian).
|
|
|
And yet another...
|
|
|
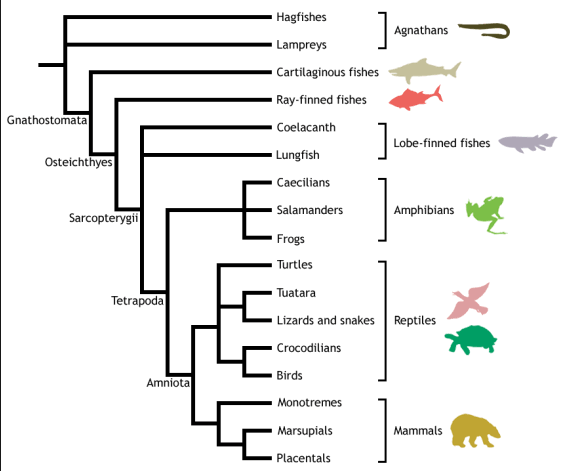
Another dendrogram with more detail. In this one the mammals are split into to their major groups - the monotremes (egg-laying), marsupials (pouched), and placentals (gestation with a placenta). Look at those three mammal groups. They are drawn in a logical way (monotremes at the top, placentals - us - at the bottom), but in fact you could swap places of marsupials and placentals and it would mean exactly the same thing because the lengths of their branches are the same. In fact, you can rotate the groups around each of the junctions without changing the diagram's meaning. So we could rotate the next junction on the mammal tree (where the tree mammal groups come off "Amniota"), which would put the monotremes at the bottom, and the marsupials and placentals above them - but the meaning of the graph would still be exactly the same. The information in a dendrogram is not where the animals are placed relative to each other, but in the order of the branches of the tree. As another example, we could rotate the group with the frogs, salamanders, and caecilians to put frogs at the top and caecilians at the bottom, and in fact since the branches all come off the same place we could put salamanders at the top and frogs in the middle. All of these versions would have identical meaning. |
|
|
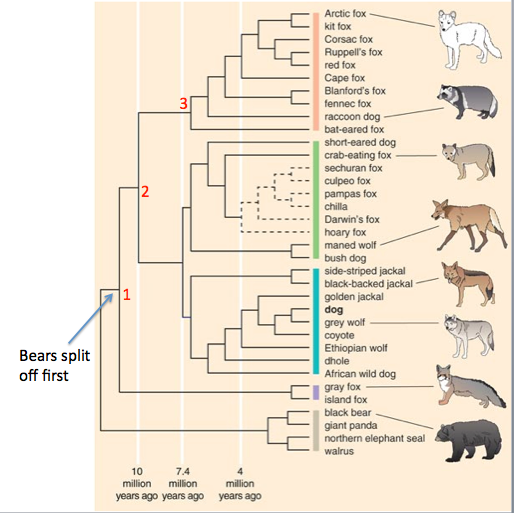
This is a dendrogram depicting the evolutionary relationships among the animals in the Order Carnivora. If you start with the bears (at the bottom) and trace their line to the left, you will see that it is the "first" path in the tree that begins at #1. This means that the animals that became bears separated from the other Carnivores first, earlier than 10 million years ago (from the scale at the bottom).
The bear line intersects with a line at #1 that divides into two groups. One group contains the gray and island fox (purple at bottom). All the other animals on the chart come off the branch that goes up from #1 to #2. This tells you that the gray and island foxes split from the rest of the Carnivores after the bears did, but before all of the other groups of carnivores. At #2, there is another split. The branch going up has a bunch of branches (orange) with various species of foxes as well as the raccoon dog. In fact, the Raccoon dog and Bat-eared fox branched off from the other foxes first, about 6-ish million years ago (from the scale at the bottom). The other branch that goes down from the split at #2 divides into a green group and a blue group that includes the dog and its closest relatives. |
|
Now here's something tricky. Remember how we showed how branches could be rotated where they come off the tree? Here's another example, just to make sure you get the idea.
There is a junction at #2 that can rotate. In fact, if we rotate the large branch of the tree that comes off at #2, the orange group that contains the foxes (at the top) can rotate down (and the blue group will rotate up) - and the orange branch of foxes will be sitting right next to the gray and island foxes. Here is the diagram, as it is originally on the left, and the same diagram with the branch at #2 rotated on the right.
There is a junction at #2 that can rotate. In fact, if we rotate the large branch of the tree that comes off at #2, the orange group that contains the foxes (at the top) can rotate down (and the blue group will rotate up) - and the orange branch of foxes will be sitting right next to the gray and island foxes. Here is the diagram, as it is originally on the left, and the same diagram with the branch at #2 rotated on the right.
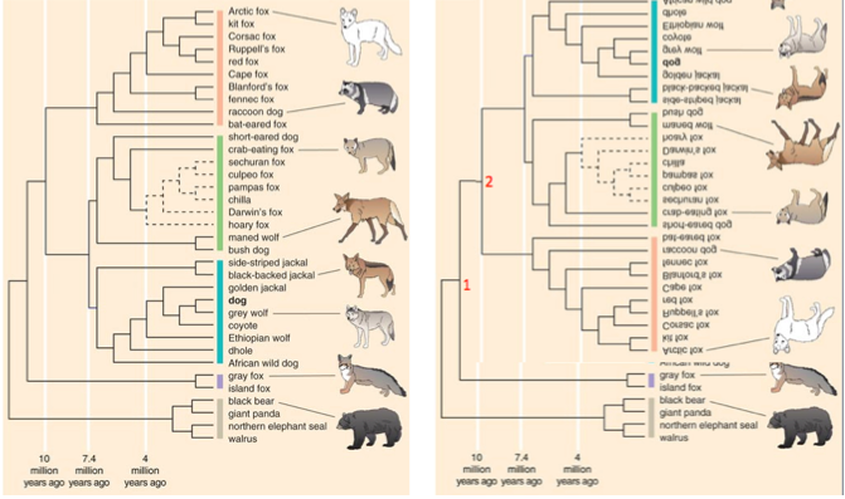
We haven't changed any of the relationships of these animals with each other by doing this. In fact, everywhere there is a branch coming off, it can be rotated in the same way. The authors for whatever reason originally drew the diagram with the foxes at the top, but they could just as correctly flipped it as we see on the right so the foxes appear next to each other. With the foxes flipped, it does make it clearer that the gray and island foxes came off the Carnivore line first, and that all of the other foxes came off at the next branch more recently. Take some time looking at how the branches on a dendrogram are organized. Don't make the mistake of thinking that things placed next to each other are most closely related; relationship is indicated by the branches as they come off the tree.
As another example, find the dog in the group that includes the grey wolf and coyote. As drawn here, the dog is most closely related to the grey wolf, and the next most related animal is the coyote. Notice that even though the dog is right next to the Golden Jackal in the drawing, the dog is more closely related to the coyote than the Jackal.
The problem with dendrograms drawn this way is that if there are lots of groups to depict, the drawing can get very large and inconvenient to view. Because of this, some other ways of drawing them have been developed, but don't let these throw you. They are still doing the same thing.
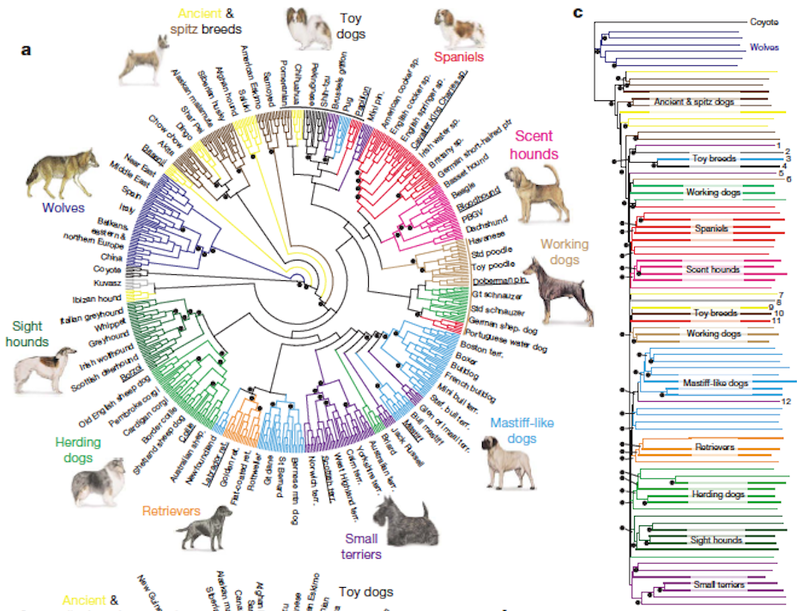
Let's look at some that describe the relationships among breeds of dogs. The diagram on the right is similar to the ones you've seen (with the branches more scrunched). The various groups of breeds have been organized based on genetic similarity from DNA studies, and each branch is a group of related breeds. in the circular dendrogram on the left, they have actually included the branch for every single animal in the study. So here you can even see groups of related dogs within breeds.
The "base" of this circular tree is right in the middle, and the first branch that comes off is the coyote, then the group that includes all of the various kinds of wolves in the world (purple). Next to split off is the Basenji (yellow). Then there is a branch that includes a bunch of "primitive" breeds, which form their own clusters off the major branch. So you will see that the Alaskan Malamute, Siberian Husky, and Shar Pei come off as a cluster then divide, as do the Akita and Chow Chow. Remember that these branches can rotate just like we saw above. So we could rotate a junction and put the sight hounds and herding dogs next to the working dogs, but the information about the relationships would be exactly the same. So you need to be careful when you look at these - don't think that the German Shorthair is closely related to the Basset Hound. We can swivel a junction and the Shorthair would be next to the Min Pin. In fact, if you trace the branch to the Shorthair, you will see that the next branch to come off is for the Irish Water Spaniel, so in this particular case those two breeds are genetically more similar to each other than to any of the other sporting breeds in this study.
As another example, find the dog in the group that includes the grey wolf and coyote. As drawn here, the dog is most closely related to the grey wolf, and the next most related animal is the coyote. Notice that even though the dog is right next to the Golden Jackal in the drawing, the dog is more closely related to the coyote than the Jackal.
The problem with dendrograms drawn this way is that if there are lots of groups to depict, the drawing can get very large and inconvenient to view. Because of this, some other ways of drawing them have been developed, but don't let these throw you. They are still doing the same thing.
Let's look at some that describe the relationships among breeds of dogs. The diagram on the right is similar to the ones you've seen (with the branches more scrunched). The various groups of breeds have been organized based on genetic similarity from DNA studies, and each branch is a group of related breeds. in the circular dendrogram on the left, they have actually included the branch for every single animal in the study. So here you can even see groups of related dogs within breeds.
The "base" of this circular tree is right in the middle, and the first branch that comes off is the coyote, then the group that includes all of the various kinds of wolves in the world (purple). Next to split off is the Basenji (yellow). Then there is a branch that includes a bunch of "primitive" breeds, which form their own clusters off the major branch. So you will see that the Alaskan Malamute, Siberian Husky, and Shar Pei come off as a cluster then divide, as do the Akita and Chow Chow. Remember that these branches can rotate just like we saw above. So we could rotate a junction and put the sight hounds and herding dogs next to the working dogs, but the information about the relationships would be exactly the same. So you need to be careful when you look at these - don't think that the German Shorthair is closely related to the Basset Hound. We can swivel a junction and the Shorthair would be next to the Min Pin. In fact, if you trace the branch to the Shorthair, you will see that the next branch to come off is for the Irish Water Spaniel, so in this particular case those two breeds are genetically more similar to each other than to any of the other sporting breeds in this study.
|
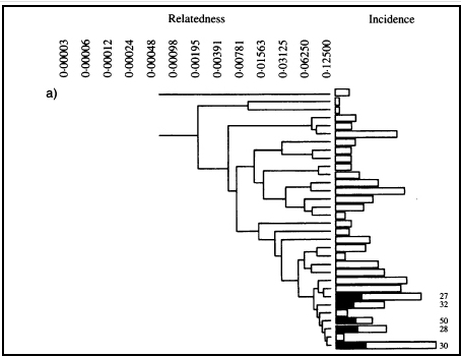
Here's a dendrogram depicting the genetic relationships among a group of Labrador Retrievers in a Dutch breeding colony for service dogs. There is a scale for this diagram at the top that shows the degree of relatedness of the animals in the groups. The root of the dendrogram is on the left, and as you go to the right the animals in each group become more closely related. At the end of each branch, instead of a name of a breed or animal, there is essentially a bar graph that depicts the number of dogs in each group; the longer the bar, the more animals. Some of the boxes are shaded, and these indicate dogs that were diagnosed with elbow dysplasia. This diagram shows that the dogs with dysplasia are all very closely related and come off the last major branch of the entire tree.
This is a great illustration of how a dendrogram could be used to identify animals that are likely to have a particular trait (in this case, elbow dysplasia) because they are genetically related to groups of affected animals. (You can read more about this dendrogram was used HERE.) |
|
|
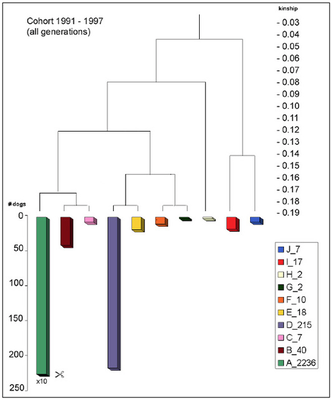
Like the one above for Labradors, this is a dendrogram of the genetic relationships among Icelandic Sheepdogs. This one is rooted at the top and has the scale for relatedness on the right, and it also uses bars to depict the size of each group.
Breeders used this graph to identify groups of less related dogs that they could breed to in order to improve genetic diversity. For example, most dogs were in the green group (which is actually 10 times larger than depicted on the graph), while some other groups contained just a handful of dogs. You can see that the groups most distantly related to the green group are blue and red, which come off together, followed by a tiny white group, then two clusters that split again, one containing the green, brown, and pink groups, and another with the purple and yellow, and the orange and black groups. (You can read more about this dendrogram was used HERE.) |
|