Portuguese Water Dog
There are additional analyses of the PWDCA database HERE.
Some of the data below (indicated) are from the 2015 genetic analyses produced by the UK Kennel Club. You can download the document for PWD as well as the publication that goes with it.
| portuguese_water_dog.pdf | |
| File Size: | 283 kb |
| File Type: | |
| lewis_et_al_2015_trends_in_genetic_diversity_for_all_kennel_club_registered_pedigree_dog_breeds.pdf | |
| File Size: | 1401 kb |
| File Type: | |
Population size
Number of dogs produced per year
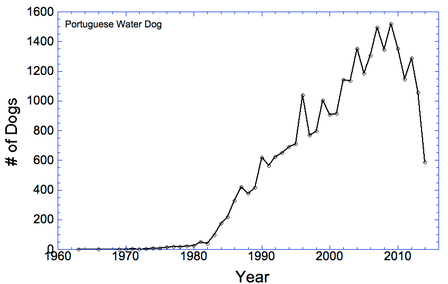
Based on the PWDCA Litter and Health database as of 27 Dec 2014, population growth started in about 1980 and has steadily increased until 2010 Figure 1). From 2011 to 2014, the number of dogs produced per year has been dropping dramatically. Updated data are needed to know if this trend continues. This rapid drop in registrations is a red flag - if fewer dogs are being produced, it's likely that there are fewer breeding; and if some of those dogs get a disproportionate share in the next generation, it will produce a bottleneck. (Read about the effects of boom-and-bust changes in population sizes here.)
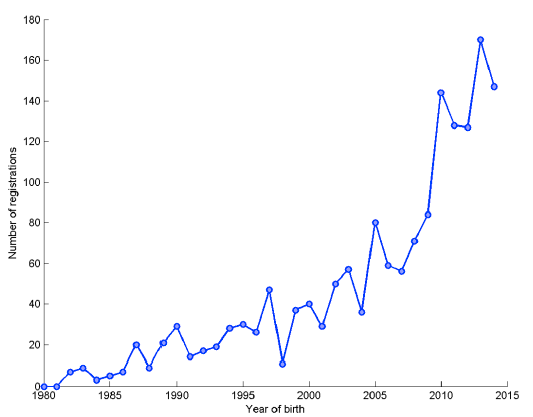
The database of the UK Kennel Club shows a (slow) increase in the number of registrations per year, but only since about 2010 have they surpassed 100/yr .
Effective Population Size
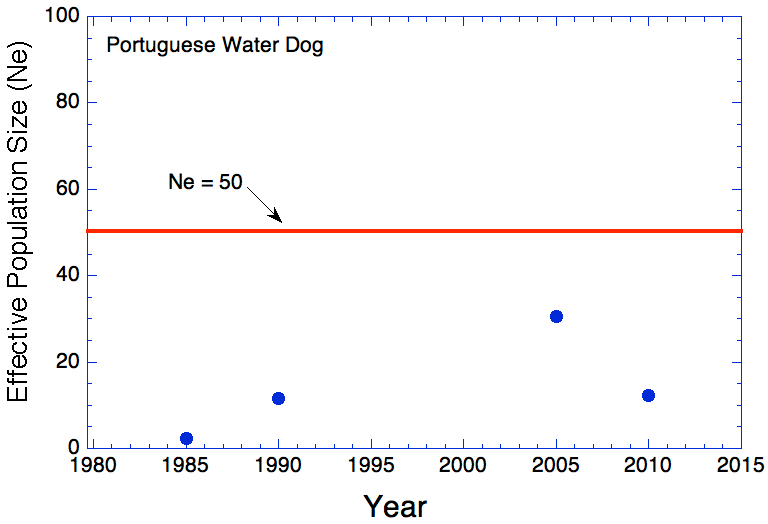
FIGURE 3: These data are from the UK Kennel Club study published in 2015 (copies for download above).
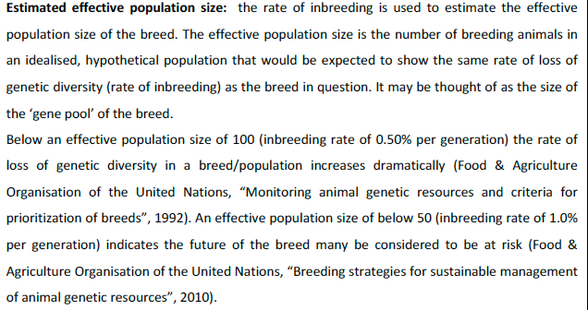
You can read more about the importance of effective population size HERE (Vulnerable breeds: how small is too small?) and HERE (A broader view of extinction risk of dog breeds in the UK). You can also read about the growing concern about small effective population sizes for the preservation of dog breeds (A call for preservation breeding).
You can read more about the importance of effective population size HERE (Vulnerable breeds: how small is too small?) and HERE (A broader view of extinction risk of dog breeds in the UK). You can also read about the growing concern about small effective population sizes for the preservation of dog breeds (A call for preservation breeding).
Genetic diversity & inbreeding
Data from MyDogDNA (MDD) for heterozygosity and population structure of PWD.
|
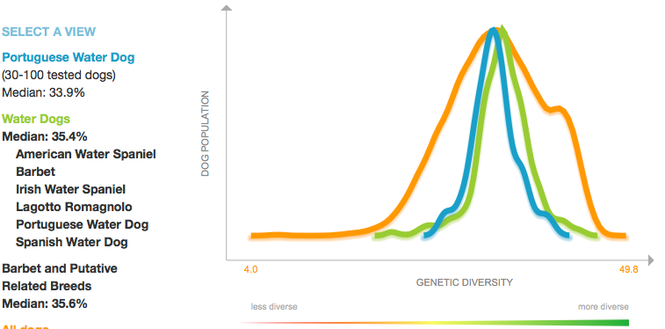
FIGURE 4: This is a graph of heterozygosity (the opposite of inbreeding), from bad (red zone) to good (green zone).
The orange line is the data for all dogs in the MDD database; the green line is for breeds related to the PWD; the blue line is the data to date for PWD. (N = 30-100 tested) Mean heterozygosity is 34%, which indicates a moderate level of inbreeding. You can compare the PWD to other breeds here - http://bit.ly/2aCLNnA |
|
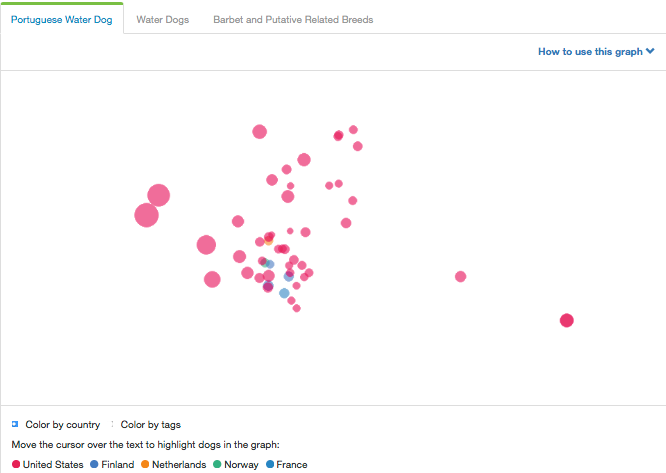
FIGURE 5: This is a graph of genetic diversity of the dogs that have been analyzed by MDD.
In this graph, each dot is a dog, and the distance between dots indicated genetic similarity or difference. There is a central cluster of points, but also a few outliers. There are not enough data yet to be able to tell if there are genetic differences between dogs from different countries. |
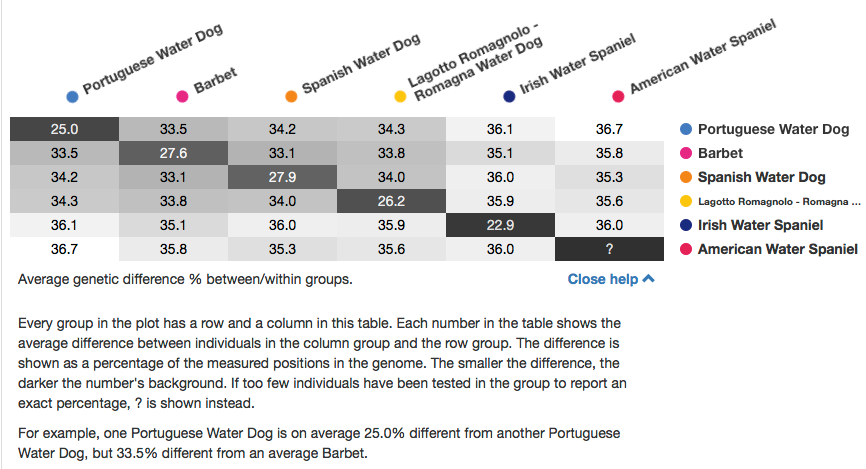
FIGURE 6: Genetic variation within and between closely related breeds (from MDD). The explanation is below the chart.
These data indicate that "one Portuguese Water Dog is on average 25% different from another Portuguese Water Dog". This indicates that the dogs in the population are on average as genetically similar as full siblings. (The genetic similarity between full siblings is 25%.) This is the lowest value of any of the water dog breeds by far.
These data indicate that "one Portuguese Water Dog is on average 25% different from another Portuguese Water Dog". This indicates that the dogs in the population are on average as genetically similar as full siblings. (The genetic similarity between full siblings is 25%.) This is the lowest value of any of the water dog breeds by far.
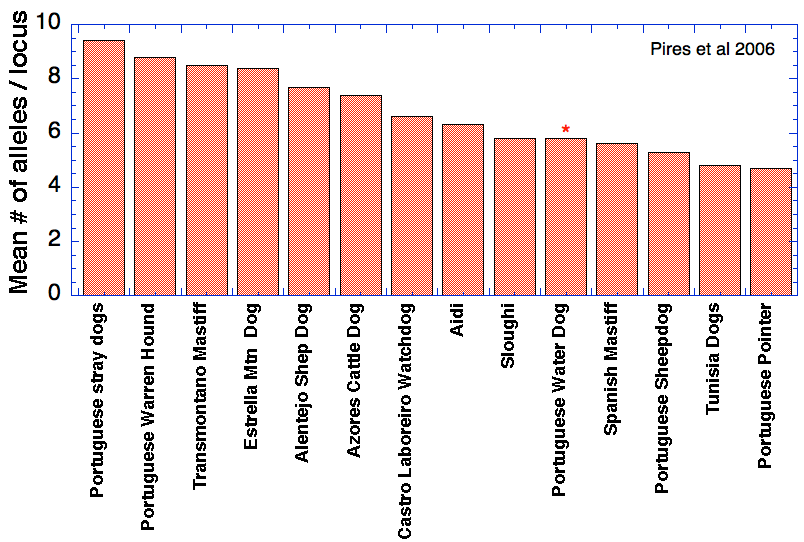
DATA FROM: Pires et al 2009. Molecular structure in peripheral dog breeds: Portuguese native breeds as a case study. Animal Genetics 40(4): DOI: 10.1111/j.1365-2052.2009.01849.x
Popular Sires
Number of offspring per sire
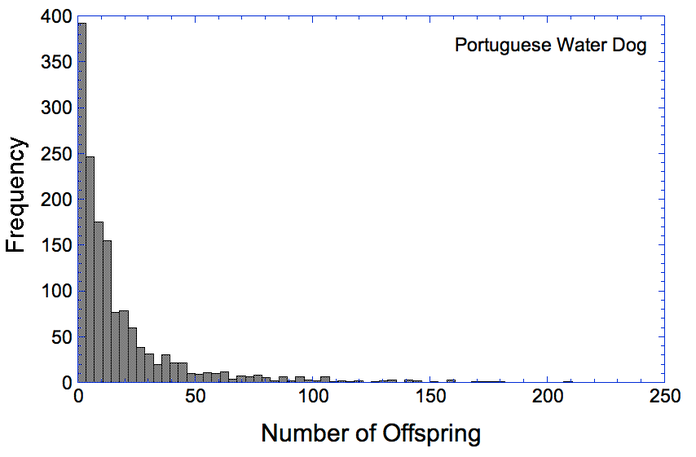
It is recommended (e.g., by the Finnish KC and others) that no dog should produce more puppies than 5% of the total number produced over 1 generation, which is usually 4-5 years (The UK KC reported 4.76 yrs based on the information in their database for years 1980-2014). (See the description of the recommendation below.) If the population was producing 600/year (the last data point in Figure 1), in 5 years that would be 3,000 dogs; 5% of that would be 150. It looks like the number of dogs being produced is dropping rapidly; if we make the total over 5 years half what it would be if breeding was steady (so one half of 3,000, or 1,500), then a sire's lifetime breeding allowance would be 75. Again, we need the up-to-date information to produce better numbers for this.
FIGURE 8: Number of offspring produced by an individual dog.
|
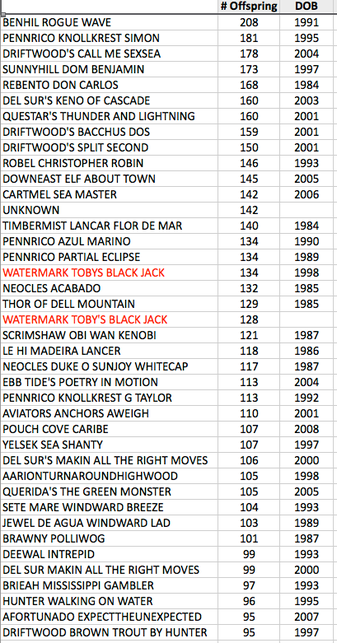
These are the top 40 or so popular sires in the PWDCA database (in Dec 2014)
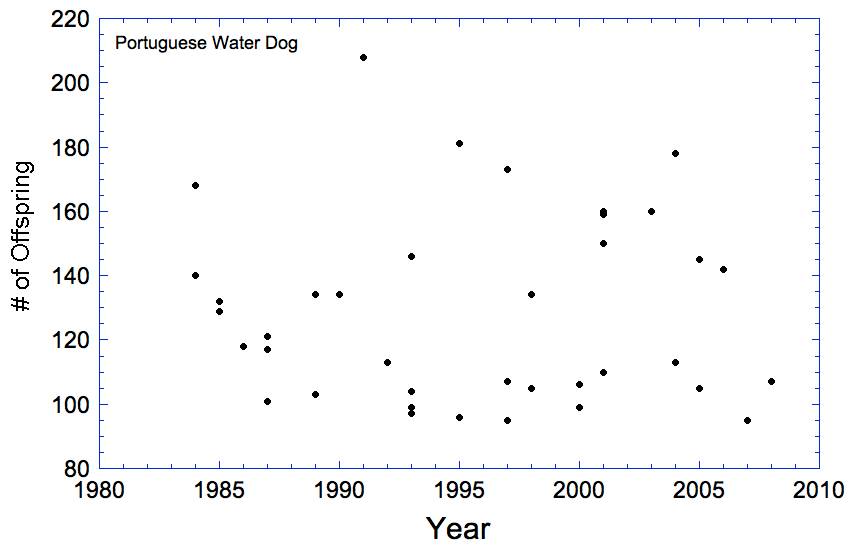
Popular sires appear regularly in the last few decades. (Watermark Toby's Black Jack is in red because for some reason it appears twice and I need to check those data. |
FIGURE 9: Number of offspring produced by popular sires since about 1984.
|
