By Carol Beuchat PhD
Inbreeding
The Coefficient of Inbreeding (COI)
Most breeders are familiar with Wright's Coefficient of Inbreeding (COI), which can be calculated from pedigree data. The COI provides an estimate of the predicted level of inbreeding based on the simple assumptions that alleles are inherited independently and with equal probability. From this, you can predict the average COI of the litter of puppies produced by a pair of dogs. Because COI is based on the probability of inheriting alleles across all generations of a pedigree, it cannot predict the COI of a dog exactly; only the average and the expected variation. However, it usually correlates well enough with "realized" inbreeding (based on DNA homozygosity) that it remains the single most useful statistic used by animal and plant breeders today to assess the level of inbreeding in an individual or the inbreeding to be expected from a particular breeding.
Most breeders are familiar with Wright's Coefficient of Inbreeding (COI), which can be calculated from pedigree data. The COI provides an estimate of the predicted level of inbreeding based on the simple assumptions that alleles are inherited independently and with equal probability. From this, you can predict the average COI of the litter of puppies produced by a pair of dogs. Because COI is based on the probability of inheriting alleles across all generations of a pedigree, it cannot predict the COI of a dog exactly; only the average and the expected variation. However, it usually correlates well enough with "realized" inbreeding (based on DNA homozygosity) that it remains the single most useful statistic used by animal and plant breeders today to assess the level of inbreeding in an individual or the inbreeding to be expected from a particular breeding.
Runs of Homozygosity (ROH)
The most common method of determining inbreeding from DNA data uses a technique that quantifies the amount of inbreeding represented in "runs of homozygosity" (ROH), which are regions of the chromosomes where there are many consecutive homozygoous loci (Ceballos et al. 2018; Curik et al 2014).
The homozygosity produced by inbreeding is not randomly scattered all over the chromosomes. Selection, both natural and artificial, will produce "hot spots" of homozygosity in the regions of the chromosome where there are genes under selection (Sams & Boyko 2018). If the genes remain under continuous selection over generations, as would be the case for the genes for type in a purebred dog population, the blocks of homozygosity will tend to get longer and longer each generation (Kim et al. 2015).
Let's look at some examples.
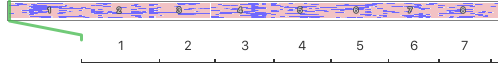
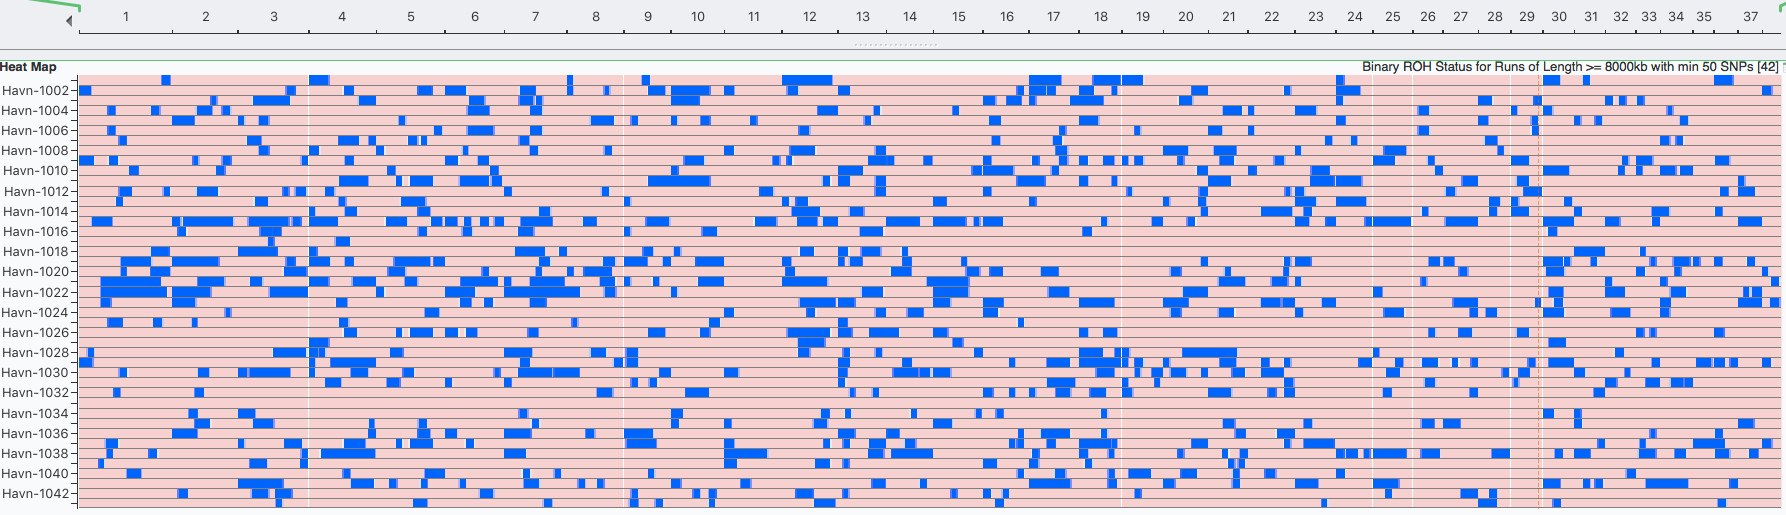
There are panels below for two breeds. The horizontal strip at the top represents the chromosomes lined up end to end to form a continuous strip the width of this page, with each of the autosomal chromosomes numbered consequitively from 1 to 38.
I've blown up a part of the strip to show you the first 7 of 38 chromosomes.
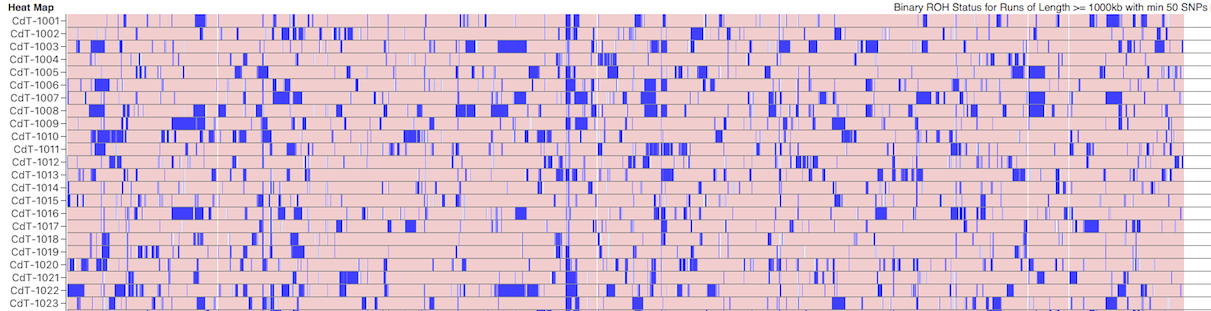
Below this is a chart depicting the blocks of homozygosity for about 80 Coton de Tulear, with each dog represented by a horizontal strip with dog IDs indicated on the left. Below this is a similar chart for a similar population of Stabyhouns. SNPs that are heterozygous are pink, while homozygous SNPs are blue.
You can see scattered across the chromosomes for the individual dogs that there are blocks of blue of various sizes. These are the runs of homozygosity.
The most common method of determining inbreeding from DNA data uses a technique that quantifies the amount of inbreeding represented in "runs of homozygosity" (ROH), which are regions of the chromosomes where there are many consecutive homozygoous loci (Ceballos et al. 2018; Curik et al 2014).
The homozygosity produced by inbreeding is not randomly scattered all over the chromosomes. Selection, both natural and artificial, will produce "hot spots" of homozygosity in the regions of the chromosome where there are genes under selection (Sams & Boyko 2018). If the genes remain under continuous selection over generations, as would be the case for the genes for type in a purebred dog population, the blocks of homozygosity will tend to get longer and longer each generation (Kim et al. 2015).
Let's look at some examples.
There are panels below for two breeds. The horizontal strip at the top represents the chromosomes lined up end to end to form a continuous strip the width of this page, with each of the autosomal chromosomes numbered consequitively from 1 to 38.
I've blown up a part of the strip to show you the first 7 of 38 chromosomes.
Below this is a chart depicting the blocks of homozygosity for about 80 Coton de Tulear, with each dog represented by a horizontal strip with dog IDs indicated on the left. Below this is a similar chart for a similar population of Stabyhouns. SNPs that are heterozygous are pink, while homozygous SNPs are blue.
You can see scattered across the chromosomes for the individual dogs that there are blocks of blue of various sizes. These are the runs of homozygosity.

Coton de Tulear
Stabyhoun
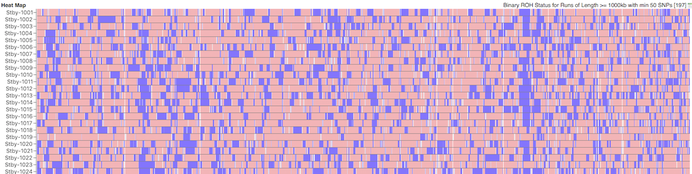
We would expect to see more blue in dogs with higher levels of inbreeding. The average level of inbreeding in the Coton de Tulear is lower than that of the Stabyhoun, and you can see this in the size and number of the blue regions of inbreeding.
Because we know that these blocks of homozygosity form as a result of inbreeding, we can use them to estimate the fraction of inbreeding across the genome by adding up the total length of runs in each dog and dividing by the total length of the chromosomes. This is the coefficient of inbreeding as estimated by ROH.
Shared Homozygosity
Something you will notice is that there are regions that are homozygous in multiple dogs, which is evident because they appear as vertical blue line across the rows where these regions all line up. There is an obvious one in chromosome 23 in the Stabyhoun, which shows up as a blue stripe about 25% from the right edge of the chart. There are other areas of shared homozygosity here and there in both breeds.
Something you will notice is that there are regions that are homozygous in multiple dogs, which is evident because they appear as vertical blue line across the rows where these regions all line up. There is an obvious one in chromosome 23 in the Stabyhoun, which shows up as a blue stripe about 25% from the right edge of the chart. There are other areas of shared homozygosity here and there in both breeds.
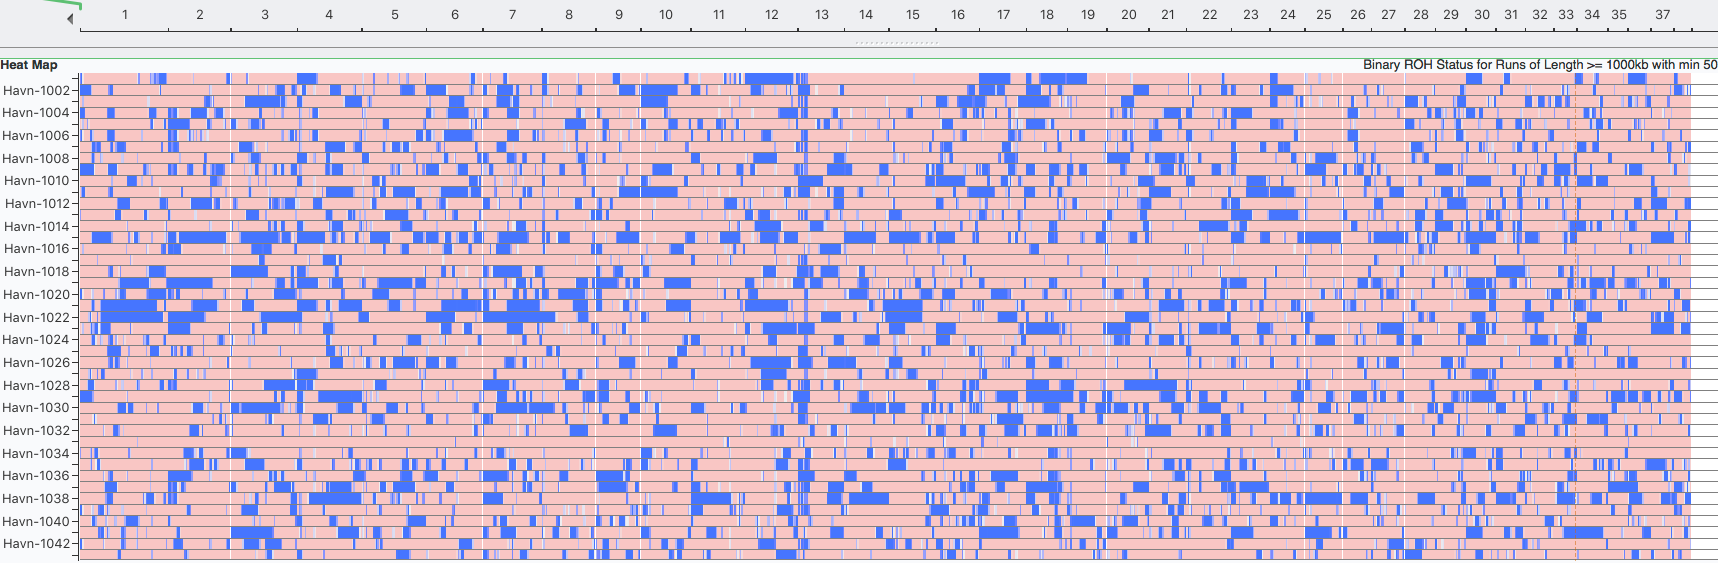
| New vs Older Inbreeding The other thing we can do with these data is detect recent versus old or even ancient inbreeding. We know that inbreeding produces longer and longer runs of homozygosity. But every generation, crossover occurs during meiosis that swaps sections of chromosomes. When breaks occur in a block of homozygosity, one larger run of homozygosity is split into two smaller ones. Therefore, we would expect ROH to get shorter over the generations, with the oldest inbreeding being evidenced by the shortest blocks. | 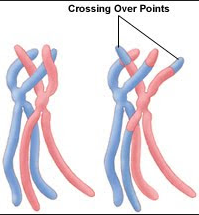 |
We can see this if we visualize these shorter blocks. The two panels below are both data for Havanese, the top one showing blocks of recent inbreeding, and the lower one showing both the large blocks of recent inbreeding as well as the short blocks of older inbreeding.
Havanese
Regions of Mutation Enrichment
Besides usefulness as a measure of inbreeding, runs of homozygosity are also relevant because they are enriched for deleterious mutations. That is, mutations get trapped in blocks of inbreeding and cause the genetic load of detrimental mutations to increase over the generations. If breeders can see where blocks of homozygosity are in the genome, they can select sires that do not share the same ROH, which will prevent the blocks from being passed on to offspring. The two individuals might have the same amount of inbreeding but distributed differently across the genome, and being able to visualize the actual inbreeding on the chromosomes can allow breeders to break up blocks using the heterozygosity at the same place in other parent.
Although there seems to be general agreement that ROH currently the method of choice for estimating the level of inbreeding from DNA, there is still discussion about the size of the blocks of homozygosity to include in the calculation (Sams & Boyko 2018). Certainly, the longest blocks represent the most recent inbreeding and should be considered, but should older inbreeding also be included? This can amount to a substantial difference in inbreeding estimates, and as yet there is no consensus on what provides the best estimate. In the meantime, comparisons should be made among individuals or between breeds using the same minimum block size, which should provide comparable estimates of the most recent inbreeding.
You can learn more about runs of homozygosity and how to use ROH to estimate inbreeding in the two-part tutorial below.
REFERENCES
Curik I, M Ferencakovic, & J Solkner. 2014. Inbreeding and runs of homozygosity: a possible solution. Livestock Science 166: 26-34.
Ceballos FC, PK Joshi, DW Clark, M Ramsay, & JF Wilson. 2018. Runs of homozygosity: windows into population history and trait architecture. Nature Reviews Genetics 19: 220-234.
Kim E-S, TS Sonstegard, CP Van Tassell, G Wiggans, & MF Rothschild. 2015. The relationship between runs of homozygosity and inbreeding in Jersey Cattle under selection. PLoS ONE 10:e0129967. https://doi.org/10.1371/journal.pone.0129967.
Marsden CD, D )rtega-Del Vecchyo, DP O'Brien, and others. 2016. Bottlenecks and selective sweeps during domestication have increased deleterious genetic variation in dogs. PNAS 113: 152-157.
Sams AJ & AR Boyko. MS. Fine-scale resolution and analysis of runs of homozygosity in domestic dogs. bioRxiv preprint (7 May 2018). doi: http://dx.doi.org/10.1101/315770.
To learn more about the genetics of dogs, check out
ICB's online courses
***************************************
Visit our Facebook Groups
ICB Institute of Canine Biology
...the latest canine news and research
ICB Breeding for the Future
...the science of animal breeding
ICB's online courses
***************************************
Visit our Facebook Groups
ICB Institute of Canine Biology
...the latest canine news and research
ICB Breeding for the Future
...the science of animal breeding