By Carol Beuchat PhD
| Early dog breeding: selection on phenotype For most of history, the creation of populations of different types of dogs was based on phenotypic selection, the preferential mating of dogs that displayed the desired traits. It wasn't until about 200 years ago that we realized that we could select for desirable traits more efficiently if we understood that phenotype reflects genotype, and that genes are the raw material of selection. From there, it was easy to understand that if we had a way to know which genes were in a dog, we could predict much more accurately what traits it was likely to pass on to its offspring then if we just knew the phenotype. Current dog breeding: selection on genes In the mid-1900s we discovered the structure of DNA, the double helix, and the physical nature of genes. Then the race was on to identify the very building blocks of the genes themselves, the nucleotides. These create the language of genetics using only four letters, A, C, T, and G. We can now read these genetic instructions in the DNA code letter by letter, using a process called DNA sequencing. When the first human genome (the genome is the entire genetic content of an animal or plant) was sequenced, it took a decade and cost $30 billion dollars. Today, we can do the same thing in a matter of a day or two and it costs about $1,000. | 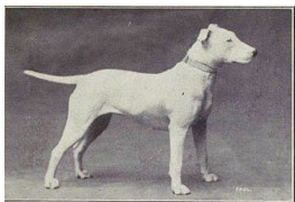 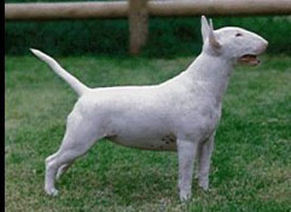 There are changes in the structure of many breeds over the last hundred years of purebred dog breeding that reflect selection on phenotype alone. |
The ability to read the genetic library of an animal has revolutionized animal breeding. Instead of trying to select for particular traits by evaluating phenotype, we can select specifically for the genes that result in or are associated with those traits. Now, we can run DNA tests on prospective breeding dogs that will tell us if an animal carries a particular disease-causing mutation, even though that mutation might have no effect at all on the dog that carries it. There are now dozens of DNA tests for known mutations in dogs, and the list will surely get longer.
The future of dog breeding: selection on genotype
Even as DNA testing has revolutionized how we breed dogs, we are still far from taking full advantage of the advances in molecular genetics. The DNA tests we now have allow selection against specific mutations, or for particular desirable traits like color, but DNA tests are not useful for complex traits that might involve dozens or even hundreds of genes. Instead, we could leverage the massive amount of information coded in the DNA if we could evaluate not just a handful of genes, but many hundreds or even thousands.
The technology now exists to do this. It's called genomic selection.
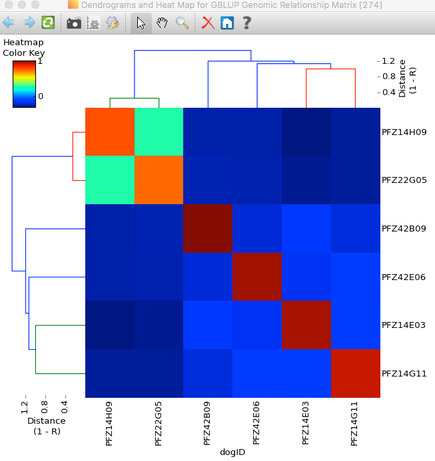
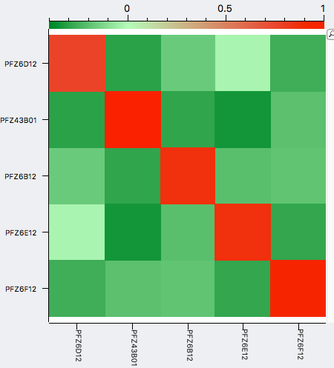 | A simple example of genomic selection Let's say that you have a bitch that you plan to breed and you've identified several potential sires to consider, any of which you would be happy with based on conformation, temperament, and health testing. You can select the sire that is likely to produce the highest genetic diversity in the puppies by comparing the genotypes of the potential parents. By comparing the DNA of two individuals, we can determine relationship coefficient, the actual fraction of genes that are shared by a pair of dogs. The chart with colored squares is a genomic relationship matrix with data for five Neapolitan mastiffs. The animal at the upper left (red square, FZ6D12) is a female.The other four dogs are males. An animal compared with itself has a relationship of 1 (red squares). In the comparison of the female to the four males, the intensity of green indicates their genetic similarity, with darker green indicating greater difference. From this, you can see that of the four potential sires, the one right next to the female on the chart (PFZ43B01) is the darkest green. It is therefore the most different from the bitch and would produce puppies with the highest genetic diversity. |
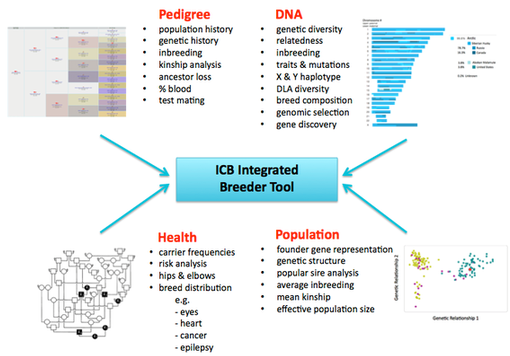
ICB is developing a tool that will allow breeders to take advantage of the tremendous amount of information coded in the genome. The ICB Breeder Tool will integrate the data from high-resolution, whole genome DNA analysis with pedigree, health, and trait data. These combined resources will provide breeders with the best information about the genetics of a dog that has ever been available. All in one database.
What's so cool about genomic selection?
a) Genomic selection allows you to select for (or against) the genes for a trait
The phenotype of a trait that you can observe or measure reflects the effects not just of genes, but of environment as well. A dog with the genes for large size might not achieve its full potential if its diet doesn't contain adequate nutrition. Using only phenotype for selection, we assume that what we can see tells us about the genes in the dog. But many traits are affected not only by genes but also environment, and we have no way to separate those two influences just by looking at phenotype. However, if we know which genes are associated with size, we can select directly for those, making breeding more efficient and predictable.
b) We can predict the traits of offspring despite uncertainty about ancestry
Historically, we have relied on pedigree relationships and information about the the traits of related dogs to predict what we might see in offspring. But we don't always have pedigree data, and selecting directly for the genes associated with a trait we want solves this problem.
c) Genomic data can be used to identify and fix errors in pedigree databases
Pedigrees carry an enormous amount of information about the relationships among dogs - if they are correct. But mistakes happen, parentage isn't always certain, and sometimes reporting isn't entirely honest. Not being able to trust a pedigree definitely limits how useful it can be. But genomic data can allow us to identify errors in a pedigree database and fix them (Munoz et al 2014).
Pedigrees carry an enormous amount of information about the relationships among dogs - if they are correct. But mistakes happen, parentage isn't always certain, and sometimes reporting isn't entirely honest. Not being able to trust a pedigree definitely limits how useful it can be. But genomic data can allow us to identify errors in a pedigree database and fix them (Munoz et al 2014).
d) Genetic and pedigree information are more powerful than either alone
Just because we can "see" the genes we want to select for, don't throw those pedigree data away! Using both pedigree and genomic data together, we can make much better predictions about the genetic value of a dog for a particular trait. Together, they are more powerful than either alone (Aguilar 2010; Do et al 2014; Dreger et al 2016; Meuwissen et al 2011; Zhang et al 2015)).
Just because we can "see" the genes we want to select for, don't throw those pedigree data away! Using both pedigree and genomic data together, we can make much better predictions about the genetic value of a dog for a particular trait. Together, they are more powerful than either alone (Aguilar 2010; Do et al 2014; Dreger et al 2016; Meuwissen et al 2011; Zhang et al 2015)).
 |  |
e) Genomics allow selection for or against traits that are not expressed
One problem with using phenotypic selection alone is that you can't select against disorders that only show up later in life. Many eye disorders, neurological and muscular dystrophies, epilepsy, and cancer foil efforts of breeders to improve health because they might not appear until later in life, after an animal has been bred. You also can't select efficiently on traits that are only expressed in one sex, like milk quality or cryptorchidism.
One problem with using phenotypic selection alone is that you can't select against disorders that only show up later in life. Many eye disorders, neurological and muscular dystrophies, epilepsy, and cancer foil efforts of breeders to improve health because they might not appear until later in life, after an animal has been bred. You also can't select efficiently on traits that are only expressed in one sex, like milk quality or cryptorchidism.
| f) Genomic selection allows us to use information from many thousands of loci across all chromosomes More information is definitely better. Before the advent of the modern SNP chip (pronounced "snip chip"), information from genomic markers called microsatellites was used in genetic prediction. Microsatellites have been used for selection and also for parentage verification for several decades, but the number of markers used is usually limited to less than 100. Using SNP technology, we can have thousands of markers on each chromosome, and the most recent version of the Illumina Canine High Density SNP chip has about 230,000. This provides vastly more information than can be obtained using a few dozen microsatellites. For this reason, SNP technology is overtaking microsatellites as the method of choice for genetic studies across the whole genome. |  |
g) Genomic selection allows us to select for (or against) traits with low heritability
The expression of a trait usually reflects the effects of both genes and environment. Heritability is a way of measuring how much of the variation in the expression of a trait is due to genes versus environment. If heritability is low, then the effects of environment make it very difficult to select genotype on the basis of phenotype alone. Genomic data can solve that problem.
The expression of a trait usually reflects the effects of both genes and environment. Heritability is a way of measuring how much of the variation in the expression of a trait is due to genes versus environment. If heritability is low, then the effects of environment make it very difficult to select genotype on the basis of phenotype alone. Genomic data can solve that problem.
h) Genomic selection does not require knowing causative alleles
Dealing with traits that result from single genes is relatively straightforward. In many cases, we can identify the allele and develop a test, and we now have an arsenal of DNA tests that are now done on breeding stock. But far more traits are polygenic and we will probably never know all of the causative genes. In these cases, we can use statistics to identify suites of genes that are associated with particular traits, even without knowing exactly what the genes do. In this way, genomic selection has been used to accomplish amazing improvements in the traits of livestock animals, as well as sport and pleasure horses, and of course many crop species.
Dealing with traits that result from single genes is relatively straightforward. In many cases, we can identify the allele and develop a test, and we now have an arsenal of DNA tests that are now done on breeding stock. But far more traits are polygenic and we will probably never know all of the causative genes. In these cases, we can use statistics to identify suites of genes that are associated with particular traits, even without knowing exactly what the genes do. In this way, genomic selection has been used to accomplish amazing improvements in the traits of livestock animals, as well as sport and pleasure horses, and of course many crop species.
Using a genomic breeding tool
ICB is introducing the first tool for genomic selection available to dog breeders that makes use of high-density SNP data (> 200,000 SNPs). It will report individual inbreeding, genomic relationship coefficients, allelic diversity, expected offspring genotypes and diversity, and clear/carrier/affected status for most known mutations. It will also report statistics for entire breeds and subpopulations such as genetic diversity, kinship, rates of inbreeding, loss of genetic diversity, and effective population size (Do et al 2014). Paired with phenotype information (e.g., health or disease records, conformation, temperament, behavior evaluations, etc), the ICB Breeder Tool can be used to produce estimated breeding values to improve the efficiency of selection for or against complex traits (Hou et al 2013).
The ICB Genomic Breeding Tool is currently in beta testing. You can read more about it HERE and HERE.
The whole genome DNA test will be available within the next couple of weeks, and we expect the Genomic Breeding Tool to be available around the beginning of the year. Watch this space for dates!
If you think your breed might be interested in participating in beta testing, please contact Dr Carol Beuchat at ICB. ([email protected])
REFERENCES
Aguilar I, I Misztal, DL Johnson, A Legarra, S Tsuruta, & TJ Lawlor. 2010. A unified approach to utilize phenotypic, full pedigree, and genomic information for genetic evaluation of Holstein final score. J Dairy Sci 93: 743-752.
Do K-T, J-H Lee, H-K Lee, J Kim, & K-D Park. 2014. Estimation of effective population size using single-nucleotide polymorphism (SNP) data in Jeju horse. J Animal Sci 56:28.
Dreger DL, M Rimbault, BW Davis, A Bhatnagar, HG Parker, & EA Ostrander. 2016. Whole genome swquence, SNP chips and pedigree structure: building demographic profiles in domestic dog breeds to optimize genetic trait mapping. Dis Model Mech 17 (in press).
Eynard SE, JJ Windig, G Leroy, R van Binsbergen & MPL Calus. 2015. The effect of rare alleles on estimated genomic relationships from whole genome sequence data. BMC Genetics 16:24.
Hou Y, Y Wang, XLu, X Zhang, Q Zhao, RJ Todhunter, & Z Zhang. 2013. Monitoring hip and elbow dysplasia achieved modest genetic improvement of 74 dog breeds over 40 years in USA. PLoS One 8(10): e76390.
Meuwissen THE, T Luan, & JA Woolliams. 2011. The unified approach to the use of genomic and pedigree information in genomic evaluations revisited. J Anim Breeding & Genetics 128: 429-439.
Munoz PR, MFR Resende Jr, DA Huber, T Quesada, MDV Resende, DB Neale, JL Wegrzyn, M Kirst, & GF Peter. 2014. Genomic relationship matrix for correcting pedigree errors in breeding populations: impact on genetic parameters and genomic selection accuracy. Crop Science 54: 1115-1123.
Zhang Q, MPL Calus, B Guldbrandtsen, MS Lund, & G Sahana. 2015. Estimation of inbreeding using pedigree, 50k SNP chip genotypes and full sequence data in three cattle breeds. BMC Genetics 16:88.
Check out
ICB's online courses
*******************
Join our Facebook Group
ICB Breeding for the Future
...the science of dog breeding
*******************
Visit our Facebook Page
ICB Institute of Canine Biology
...the latest canine news and research
ICB's online courses
*******************
Join our Facebook Group
ICB Breeding for the Future
...the science of dog breeding
*******************
Visit our Facebook Page
ICB Institute of Canine Biology
...the latest canine news and research