The Institute of Canine Biology
  • HOME
  • Blog
  • Courses
    • COI BootCamp (FREE!)
    • Basic Population Genetics (FREE)
    • The Science of Canine Husbandry
    • Managing Genetics For the Future >
      • Syllabus - Managing Genetics for the Future
    • The Biology of Dogs (Open Reg )
    • DNA For Dog Breeders >
      • Syllabus - DNA for Dog Breeders
      • Open Reg - DNA For Dog Breeders
    • Understanding Hip & Elbow Dysplasia >
      • Open Reg - Understanding Hip & Elbow Dysplasia
    • Genetics of Behavior & Performance >
      • Syllabus - Genetics Behavior & Performance
      • Open Reg - Genetics of Behavior & Performance (Open Reg)
    • Strategies for Preservation Breeding >
      • Open Reg - Strategies for Preservation Breeding
    • Group Discounts
    • MORE FREE COURSES >
      • Quickie Genetics (Free!)
      • Heredity & Genetics (Free!)
      • Useful Genetics (Free!)
      • Basic Genetics Videos
  • Breed Preservation
    • Breed Status
    • Breeding for the future >
      • BFF Breed Groups
    • The "Elevator Pitch"
    • What's in the Gene Pool?
    • The Pox of Popular Sires
    • What population genetics can tell us about a breed
    • What population genetics can tell you...Tollers & Heelers
    • How to use kinship data
    • Using EBVs to breed better dogs >
      • How population size affects inbreeding
      • EBV Examples
    • How to read a dendrogram
    • Global Pedigree Project >
      • The Database
    • Finding the genes without DNA
    • How to read a heat map
  • Health Data
    • Bloat (Purdue Study)
    • Body Condition Score >
      • % Dysplastic vs BCS
    • Breed Comparions
    • Cancer
    • Cardiac
    • Cataracts
    • Caesareans
    • Deafness
    • Degenerative Myelopathy
    • Elbow Dysplasia
    • Epilepsy
    • Genetic Diversity
    • Genetic Diversity (MyDogDNA)
    • Hip Dysplasia >
      • Hip Dysplasia (Hou et al 2013)
    • Inbreeding Effects
    • Inbreeding (Gubbels)
    • Inbreeding (Dreger)
    • Lifespan
    • Litter size
    • Metabolic
    • mtDNA
    • Orthopedic
    • Mode of Inheritance
    • Patella Luxation
    • Thyroid
    • Portosystemic shunt
    • Purebred vs Mixed (UC Davis)
    • Purebred vs Mixed Breed (Bonnett)
    • Spay & Neuter Effects
    • Calboli et al 2008
    • Hodgman (1963)
    • Scott & Fuller (1965)
    • Stockard: Purebred crosses
    • Summers (2011)
  • Projects
    • How To Interpret Breed Analyses
    • Afghan Hound
    • More details about the Toller study
    • Belgian Tervuren >
      • Belgian Terv p2
      • Belgians- why population size matters
    • Bernese Mountain Dog
    • Boxer
    • Brussels Griffon
    • Bullmastiff
    • Canaan Dog >
      • Canaan analyses
    • Cesky Terrier >
      • Cesky genetic history
    • Chinook
    • Curly-coated Retriever
    • Doberman
    • Entelbucher Mountain Dog
    • Flatcoat Retriever
    • French Bulldog
    • German Shorthair
    • Golden Retriever >
      • Golden Retriever Pedigree Charts
    • Irish Water Spaniel >
      • IWS (6 Nov 17)
    • Labrador Retriever
    • Manchester Terrier
    • Mongolian Bankhar >
      • Research Updates
      • Bankhar 1
    • Norwegian Lundehund
    • Plummer Terrier
    • Otterhound
    • Portuguese Water Dog >
      • Portuguese Water Dog (pt 2)
    • Ridgeback
    • Schipperke
    • Standard Poodle >
      • The Problem With Poodles
      • 3poodle pedigree charts
      • 3Poodle Wycliff dogs
      • Poodle Genetics
    • Tibetan Spaniel
    • Tibetan Mastiff
    • West Highland White Terrier
    • Whippet
    • Wirehaired Pointing Griffons
    • UK KC Graphs >
      • UK KC Breed Status
      • UK Groups
      • KC Gundogs
      • KC Hounds
      • KC Terriers >
        • Terriers (select breeds)
      • KC Pastoral
      • KC Toys
      • KC Working
      • KC Utility
      • Australian KC
    • Breed outcrossing programs
  • Resources
    • Genetics Databases
    • Stud Books >
      • American Kennel Club stud books
      • Field Dog stud books
      • The Kennel Club (UK)
    • Learn
    • Videos about dog genetics
    • The Amazing Things Dogs Do! (videos) >
      • Livestock Management
      • Livestock guarding
      • Transportation, exploration, racing
      • Conservation & wildlife management
      • Detection Dogs
      • Medicine & Research
      • Entertainment
      • AKC/CHF Podcasts
    • Read & Watch
    • Bookshelf
  • Preventing Uterine Inertia

Cool tricks with Kinship Coefficients, part 4: "How closely related are the dogs in my breed?"

9/7/2018

 
By Carol Beuchat PhD

One of the problems with strong selection in a closed gene pool is that the dogs become progressively more and more similar genetically. Although selective breeding in purebred dogs results in consistency, it also has the downside that a breed can find itself stuck in a genetic cul-de-sac from which it can't escape. If you need to change the direction of selection, for example to breed towards a different trait or away from a genetic disorder, you need to find dogs with the genetic diversity necessary to support selection in a different direction. Genetic diversity is the raw material for selection; you can't change anything without it.

How much genetic diversity is there in your breed? How can you find the dogs that might have the genetic variation that you're looking for?
​
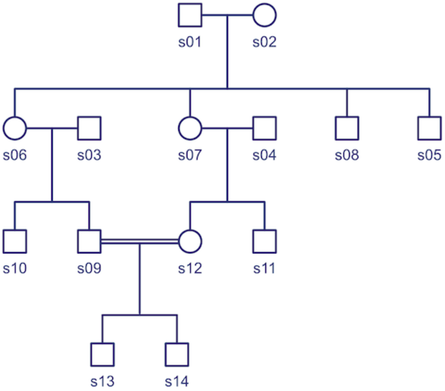
There are several different ways to determine how much genetic diversity there is in your breed, but let's look at one that uses the kinship coefficients that we have already been talking about (see Parts 1, 2, and 3 in this series; links at the bottom).

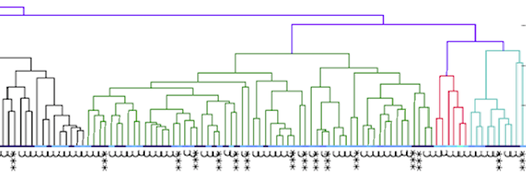
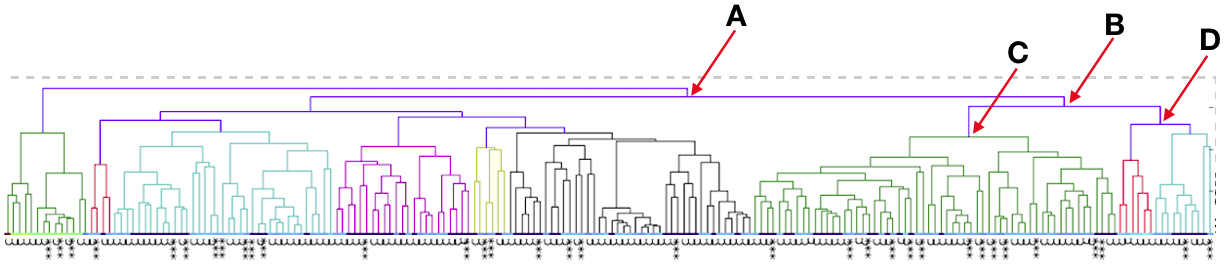
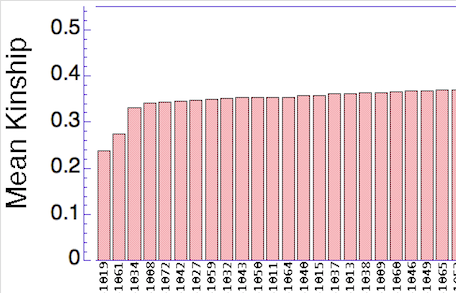
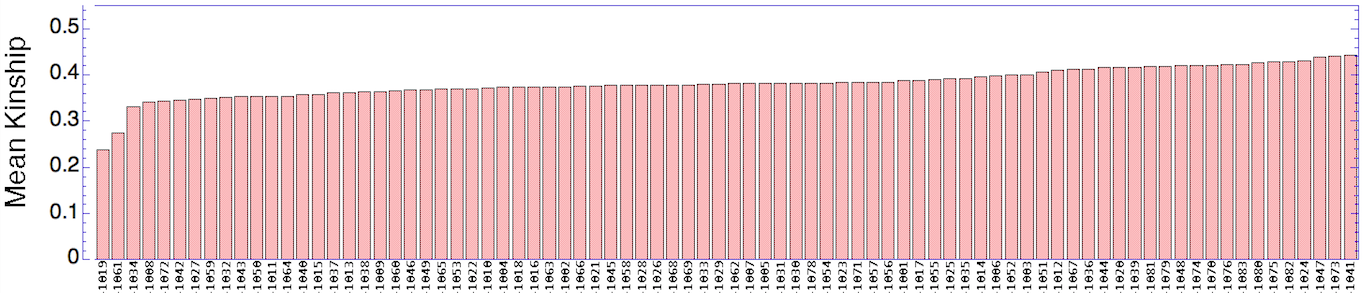
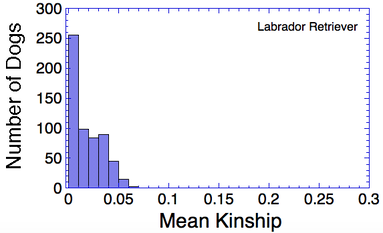
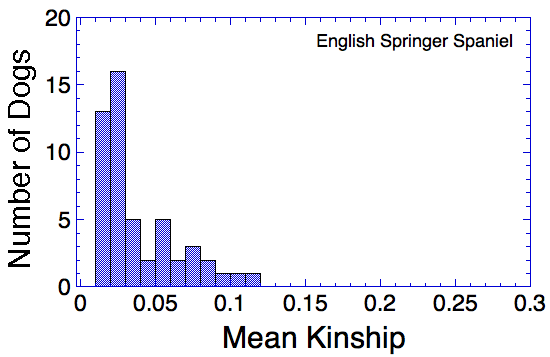
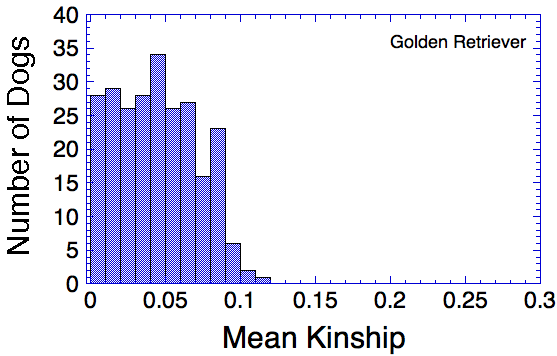
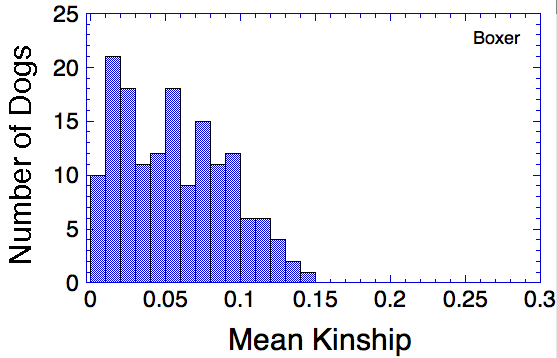
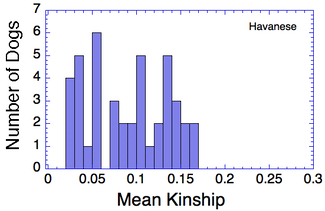
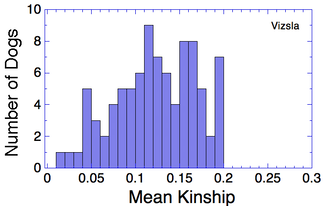
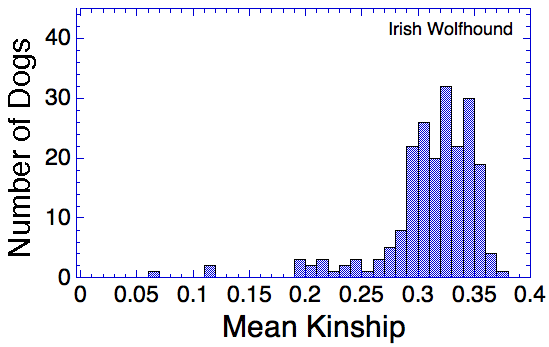
Let's say that we have a population of animals that are not closely related. If we compare the genes in each dog with those in every other dog in the population, we can compute each dog's mean kinship, which I explained in a previous post. Since we know the dogs in our population are relatively unrelated, we know that the values for mean kinship will be low (they can range from 0 to 1). If we graph the mean kinship of all of the dogs in the population, we might get a chart that looks like the first one on the left below for Labrador Retrievers, in which all of the values are less than about 0.06. On the other hand, if we have a population of closely related dogs, we might get a graph like the last one on the right below for Irish Wolfhounds, in which most of the values are greater than 0.3. If you scan the graphs for the other breeds depicted below, you will see that the distribution of values for mean kinship can vary considerably.

Picture
Picture
Picture
Picture
Picture
Picture
Picture
Picture

What do these graphs tell us about genetic diversity?

Remember that mean kinship is the average relatedness of a dog to all others in the population. The Labrador Retriever is one of the most popular breeds in the world so numbers are very high, and there are populations of show dogs, hunting dogs, personal pets that will all be a bit different from each other genetically, and populations in different countries will probably be different from each other as well. This is a breed with a LOT of genetic diversity, and the mean kinship values are mostly low. But if you were to make another graph with just the show dogs, the distribution would probably be skewed towards higher values because those dogs would be more closely related to each other than they are to field line dogs.

When you compare Labradors with Irish Wolfhounds, the graph is skewed strongly towards much higher values. This indicates in this population of over 200 dogs, the average relatedness was very high. The exception is a few dogs that fall far below the pack and are not closely related to the bulk of the population. This indicates that most of the dogs are closely related to each other.
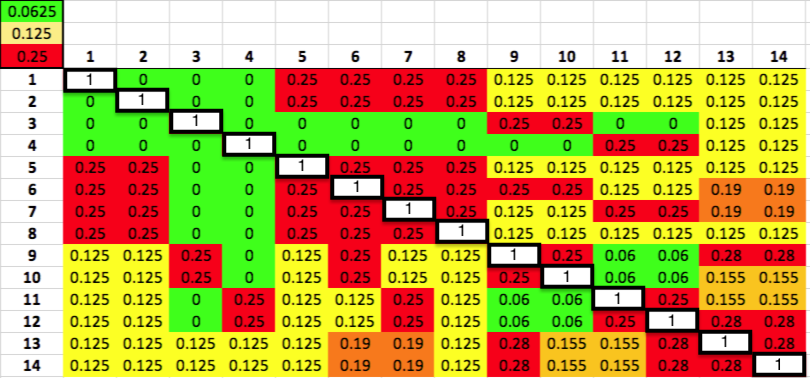
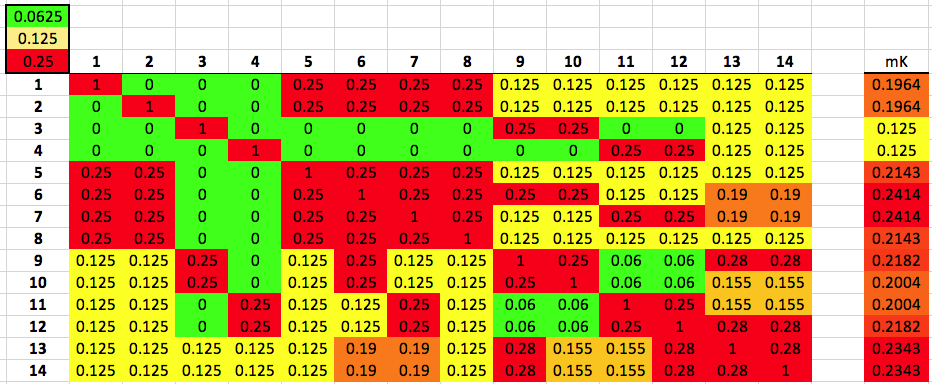
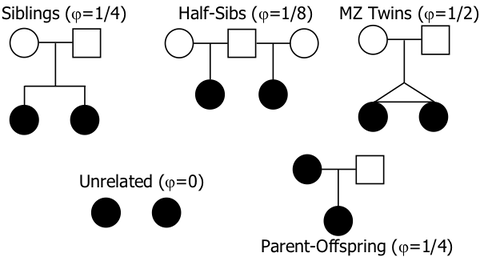
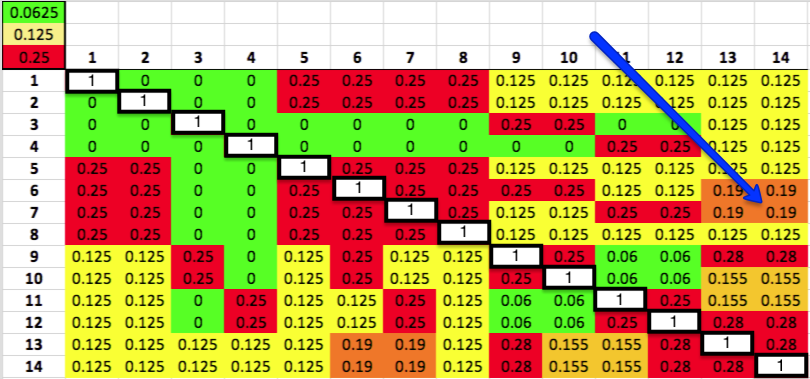
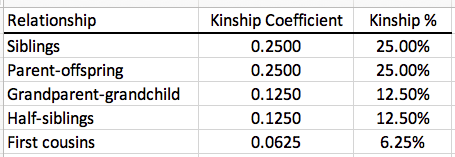
Because the kinship coefficient is based on genes that are the same because they are inherited from the same ancestors, we can interpret these graphs in terms of relatedness. If you breed two first cousins from parents that are not inbred, the predicted inbreeding coefficient of their offspring is 0.0625, or 6.25%. Looking at the graph at the top for Labrador Retrievers, we can see that most of the values of mean kinship are lower than 0.06. So we can say for this population that on average, the Labradors are less related than first cousins. 

You can do the same thing for the graphs for other breeds, using this chart for the kinship coefficients for each level of relatedness.
​
Picture

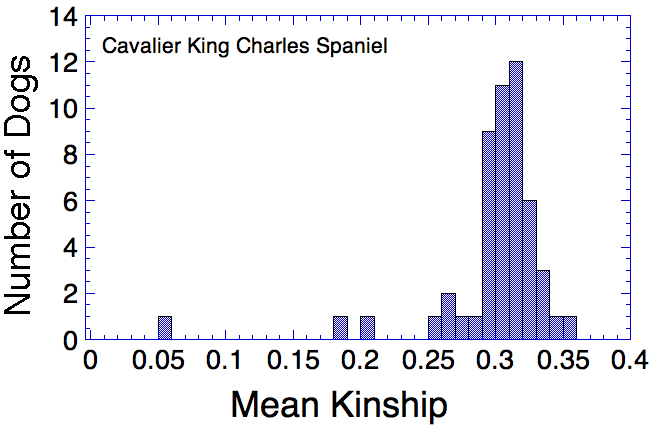
So, looking at the chart for Irish Wolfhounds (bottom right), you can see that most of the dogs have a mean kinship > 0.25; that is, on average most of these dogs are more closely related to each other than full siblings. Imagine a family reunion with a few aunts, uncles, and cousins, and 134 of your siblings. This is a breed with a very high level of average relatedness to each other. Likewise for Cavalier King Charles Spaniels. In the small sample of Havanese, there two clusters of dogs, one with a relatively high level of relatedness to each other, and another with rather low relatedness. 
There are several different ways to understand the genetic diversity in your breed. Here, we show you how you can use the kinship coefficient to provide information about the average levels of relatedness in a population of dogs. This is another tool you can add to your genetic toolbox!

We can provide genetic analyses like these for any breed from both
pedigree and DNA data using the ICB Breeder Tool.

Are you interested in using the ICB Breeder Tool with your breed?
Contact us to get started!

Picture

RELATED TOPICS

Cool tricks with Kinship Coefficients, part 1: "Is this dog really an outcross"?
Cool tricks with Kinship Coefficients, part 2: "Should I breed this dog?"
Cool tricks with Kinship Coefficients, part 3: "How can I manage a disease without a DNA test?"

To learn more about the genetics of dogs, check out
ICB's online courses

***************************************

Visit our Facebook Groups

ICB Institute of Canine Biology
...the latest canine news and research

ICB Breeding for the Future
...the science of animal breeding

Cool tricks with Kinship Coefficients, part 3: "How can I manage a disease without a DNA test?"

9/6/2018

 
By Carol Beuchat PhD

This is part 3 of "Cool tricks with kinship coefficients". Check out "Part 1: Is this dog really an outcross?" and "Part 2: Should I breed this dog?"

About 80% of the genetics diseases we know about in dogs are caused by a single recessive mutation. Using modern DNA technology that enables us to scan thousands or millions of markers in a dog's genome, we can usually find these broken alleles and develop a test that breeders can use to screen their dogs.

Many disorders, however, are not the result of a single mutation. For these, there might be dozens or even hundreds of genes involved. Creation of a test that will identify an affected dog with no symptoms, one likely to produce affected offspring, is not likely to happen for most of these. This is a huge problem for breeders, because many of these diseases, like cancer, epilepsy, autoimmune dysfunction are very serious and becoming more and more common. Yet they do seem to run in related dogs, so we know genetics is important. How can we manage these diseases if we don't have a DNA test? We can use kinship coefficients. Watch this.

Kinship coefficients provide information about the relatedness of dogs by assessing pairwise genetic similarity. A statistical technique called cluster analysis can use the kinship data to construct a dendrogram - a genomic pedigree - that groups dogs together that are closely related and also indicates the relationships among groups. If a trait or disease has a genetic component, we should expect that clusters of closely related dogs are more likely to share traits than unrelated dogs because they share many of the same genes. ​

​This is a dendrogram constructed using kinship coefficients computed from DNA data for 211 Irish Wolfhounds. The upper figure is the right to the right blown up so you can see a bit easier, and the lower chart is the entire dendrogram. 

Picture
Picture

Let's take a little tour of the lower chart. You can see that the population of dogs has been separated into two smaller groups at the arrow labeled "A". If we follow the branch that comes off point A to the right, we come to a second branch at the arrow B that creates two subgroups. If we follow that branch at B to the left, we come to branch C that again splits the dogs into two groups. You can see now that is called a dendrogram because it is a picture of a structure that branches like a tree.

Dendrograms are a bit tricky to read properly and getting good at it takes some practice. You need to remember that branches can rotate around any branching point. So for instance, the very top branch that divides at A can be rotated around the junction at A so that the green group on the far left is moved to the far right to sit nest to the turquoise group. Clearly, that green group is not most closely related to the red group that was right next to it at when it was at the left end of the chart. For that matter, we can rotate the two groups on the far right (at arrow D) so  the green group is now right next to the red group. So there are actually many different ways to arrange the clusters that don't change their relationships to each other. This is because relatedness is indicated by the length of the lines that connect groups or dogs. Dogs connected by very short lines are closely related, and dogs that are more distantly related are connected by longer lines. When we swivel groups around branching points, the length of the connecting lines is not changed so the information about relatedness is not changed. (Check out How to read a dendrogram)
Now we have a picture of the genetic relationships among all of the 211 dogs in this sample. We also have information about which of these dogs has been diagnosed with epilepsy. This is indicated by the three asterisks ("***") at the tip of the branch for each dog. For dogs without asterisks, this could be because they have never reported epilepsy or we have no information. So this chart can't be taken as a representation of which dogs have epilepsy and which do not. It only tells us which dogs have reported a diagnosis of epilepsy.
So, what does this graph tell us? We can see that affected dogs tend to cluster together by family groups, which likely reflects a genetic component to disease risk. Unfortunately, there are no large groups where epilepsy is completely absent. This tells you that the genetic predisposition to epilepsy is widely, but possibly not uniformly,  distributed throughout this population of dogs. With some good record-keeping and the addition of data to the database, we might be able to come up with a clearer picture of the patterns of risk that can be used to make breeding choices that will reduce the number of affected dogs.

There are many breeds battling to control genetic disorders for which there are no DNA tests, or the test is unreliable for identifying dogs that will develop the disease (e.g., degenerative myelopathy). For these, kinship analysis could provide very useful information to breeders about risk of disease. Of course, the same technique described here could also be used for diseases caused by single mutations. If incidence of all genetic disorders was mapped on a dendrogram and kept up to date, breeders could notice a problem developing long before it becomes widespread in the breed and difficult to manage because of the high frequency of carriers. 

One caveat about dendrograms from kinship coefficients. The cluster analysis uses the information for all dogs in a sample population to construct a tree that is most likely to reflect their true relationship. If more dogs are added to the population, the groups might be sorted differently because the relationships among them are changed. So to be useful, data for kinship should be updated regularly and needs to accurately represent the genetic breadth of the population of interest. This would be true 
We can produce kinship coefficient from both pedigree and DNA databases. There is some advantage to the DNA data because it will distinguish differences in relatedness among siblings whereas pedigree data does not. On the other hand, the pedigree information is invaluable because it doesn't require collecting a DNA sample and the cost of analysis. If you aren't trying to compare siblings, you need to run only one or maybe two dogs in a litter, which can reduce the expense considerably.
​
Think about the valuable information analysis of kinship coefficients could provide to inform your breeding decisions and managing the genetic diversity of the breed. If you have a pedigree database or genotype analysis from high density SNPs, it would be well worth doing.
​

Picture

To learn more about the genetics of dogs, check out
ICB's online courses

***************************************

Visit our Facebook Groups

ICB Institute of Canine Biology
...the latest canine news and research

ICB Breeding for the Future
...the science of animal breeding

Cool tricks with Kinship Coefficients, part 2: "Should I breed this dog?"

9/5/2018

 
By Carol Beuchat PhD

This is part 2 of "Cool tricks with kinship coefficients". Check out "Part 1: Is this dog really an outcross?"

One of the major ways genetic diversity is lost from a breed is through selection. In wild animal populations, most animals produce offspring and pass their genes to a new generation. The progeny that inherit the best combinations of genes survive and reproduce themselves, and those that were not as lucky are culled by natural selection. 

In dogs, we often breed only one or two puppies from a litter, selecting those that we feel best suit the goals of the breeder and are good representatives of the breed. But if you started with a sire and dam that you felt were quality dogs, all of those puppies should have "quality" genes but in different combinations, some of which make for a "better" puppy than others. When the pups judged to be less suitable are not bred, we risk losing from the gene pool some of the genes that produced the good quality in the parents. We limit our future breeding options when we lose those genes, and we also remove the opportunity of tossing them together with a mix of genes from another parent dog to perhaps produce something wonderful. You can't breed every dog, and not every dog is worth breeding.

If you breed for both quality (on whatever scale) and health (and of course you do, right?), you should be concerned about the inadvertent loss of genetic diversity that results from selective breeding because eroding the genetic base of the breed will have consequences down the line. But how do you determine which dogs are important for preserving genetic diversity? You can use the kinship coefficient.

The kinship coefficient (K) is an estimate of the genetic similarity of two animals that are related by ancestry. As I explained in Part 1 of this series (Cool tricks with kinship coefficients, part 1: Is this dog really an outcross?), the kinship coefficient of the sire and dam determines the inbreeding coefficient of their litter. Put another way, the inbreeding coefficient of a dog is the kinship coefficient of its parents. (And remember from part 1 that K must always be a comparison of two individuals.) We are going to see how you can use the kinship coefficient to assess the genetic value of a dog to the breed.

Below is the same kinship matrix we talked about in my previous post about kinship coefficients. Again, the white squares on the diagonal are each dog compared to itself (so K = 1), and the other squares are color-
​coded to make it easy to spot combinations that are less (or more) related to each other.

Picture

We can use the color coding indicated in the three squares in the upper left corner on the matrix to easily spot dogs that are closely related to other dogs (i.e., green, yellow, and red). If you follow across the rows of dogs 6 and 7 from left to right (or follow down the columns for these two dogs if you prefer), you will see that there are lots of red, orange, and yellow squares, indicating dogs as closely related to 6 and 7 as half-siblings (K = 0.125) to full siblings (K = 0.25). This means that the genes in dogs 6 and 7 are also found in other dogs in the population because they share ancestry.

Now do the same thing for dogs 3 and 4. You will find that most of the squares are green, indicating that they are not closely related to most of the dogs in this group. Interestingly, 3 is as related as a full sibling to 9 and 10 (K = 0.25), which are likewise closely related to each other; similarly, 4 is closely related to 11 and 12, which are likewise  as related as full siblings. It would be interesting to look at the genealogical relationships among these four dogs from pedigrees. 

If dogs 6 and 7 have many relatives in the population and dogs 3 and 4 have very few, then the latter pair are genetically more valuable because they carry genes that are not common among these dogs. It is fairly easy to identify the genetically important dogs in this small example population, but how can we do it with a large population of dogs with complicated patterns of relationship?


The easiest way is by computing the mean (average) of all of the kinship coefficients for each animal. In the figure below, have added a column on the right labeled mK, for "mean kinship". It is easily computed by adding up all the values in a row and dividing by the number of dogs. (The kinship coefficient of each dog with itself is included in the calculation.) Now we have a column of numbers in which it is easy to see which dogs, by the bright yellow squares, are most genetically different from the rest. Although on average, they are as related as half-siblings to the rest of the population, we know that it includes dogs with little or no relatedness, and you should keep this in mind when you are comparing the values for different dogs. It is always worth examining the kinship matrix to see whether a dog with K = 0.125 is closely related to everybody, or instead is unrelated to most of the dogs but closely related to a few that drive up the average (as here).
​
Picture

Now we can use the data for mean kinship to quickly identify the dogs that are genetically most valuable in a large population.  The simple bar graph organizes the dogs by rank, with the lowest values of K to the left - the dogs with the highest genetic value - and high values to the right (the dogs with lowest genetic value). In this population, there are a few dogs with high genetic value, but most of the rest of the population is closely related.

Picture
Picture

We should be using kinship coefficients much more than we are, and that is to the detriment of maintaining genetic diversity in our breeds. Breeders should know which dogs are genetically valuable, even if they aren't the top winners in competition, because the genetic variation they carry is the raw material for breed improvement in the future. Lines lost are lost forever. Perhaps breed clubs should have a genetic diversity committee that is responsible for monitoring the population to prevent loss of variation, or this could fall to the health committee because diversity and health go hand in hand. Note that if everybody rushes to breed to the least related dogs, their genes will become common and intermixed in a way that prevents them from being used strategically to manage genetic diversity. Diversity should be exploited strategically. (For the same reason, there should be a "popular sire" monitor, whose job it is to keep an eye out for sires producing more than their fair share of puppies.)

Learn how to use the kinship coefficient to take some of the guesswork out of decisions about genetic relatedness or uniqueness when you are considering your future breeding plans. This simple tool can provide you with a wealth of valuable information!

Learn how you can use kinship coefficients in
​this terrific new ICB course!

​
NEW COURSE!

Strategies for Preservation Breeding

Starts 10 September 2018

15 weeks, $189

Join us!

To learn more about the genetics of dogs, check out
ICB's online courses

***************************************

Visit our Facebook Groups

ICB Institute of Canine Biology
...the latest canine news and research

ICB Breeding for the Future
...the science of animal breeding

Cool tricks with Kinship Coefficients, part 1: "Is this dog really an outcross?"

9/3/2018

 
By Carol Beuchat PhD
​
Every few generations, it's a good idea to cross out to a relatively unrelated dog to bring in some new genetic diversity and freshen up your lines. But finding the right dog to do this with can be tricky. A dog that doesn't share any ancestors with the dog you want to breed in the last 5 or 6 generations might have enough shared ancestors farther back in the pedigree to provide a lot of relatedness. Or even worse, maybe you don't have a decent pedigree database so you really have no idea how closely two dogs might be related. This is an especially irksome problem if you're contemplating bringing in an expensive import. You really don't want to get it wrong. 

So what do you do? How can you identify a dog that will be a good outcross for your breeding program?
​
Picture
How related are these two dogs?
Conservation genetics has the perfect tool for this. It's called the "kinship coefficient" (K), and it measures the genetic similarity between two individuals (Li et al 2011).

In particular, the kinship coefficient tells you how much of the genomes of two dogs are the shared because they were inherited from a common ancestor. (You will also see the kinship coefficient referred to as the "coancestry coefficient"; they are the same.)

The kinship coefficient reflects shared ancestry (coancestry) in the same way as the coefficient of inbreeding. First cousins will, on average, share 6.25% of their genomes, and K for the pair will be 0.0625. In half-siblings, the prediction of fraction shared is 12.5%, or K = 0.125; and for full siblings K = 0.25, or 25%. 
The kinship coefficient is related to the coefficient of inbreeding: the coefficient of inbreeding of a dog is the kinship coefficient of its parents. So, the kinship coefficient between a potential sire and dam is also the predicted inbreeding coefficient of their litter. The kinship coefficient in population genetics uses the Greek symbol phi, as in this figure.
​
Picture

The kinship coefficient can be calculated from a pedigree database, just as inbreeding coefficients are. But it can also be estimated directly from DNA data - in effect, the "realized" kinship coefficient that reflects the actual level of shared ancestry between two dogs based on their DNA.
​​
Let's look at this very simple pedigree containing 14 dogs. Perhaps you were contemplating doing a breeding between dogs 14 and 7, but you are worried that it might be too close. You want to know how closely related - genetically similar - those two dog are. The kinship coefficient will tell you this. Here's how.
​
Picture

The kinship coefficient is always a comparison of two dogs. You can compute the K for each pair of the dogs in the pedigree and display them in the form of a matrix. Each dog is listed down the side and also across the top. The number in the box where the column and row of a pair of dogs intersects is the kinship coefficient of that pair. The white boxes on the diagonal are each dog compared with itself.
 
Picture

For example, we can determine that the kinship coefficient between dog 14 and dog 7 is 0.19, or 19%. This means that if you were to choose one allele at random from the pair of alleles at a particular locus on the DNA of dog 14, and likewise choose an allele at random from that locus for dog 7, the probability of choosing two alleles that are identical because they were inherited from a common ancestor is 0.19, or 19%. To put it another way, the chance that the offspring of this pair of dogs will be homozygous at that allele (have two identical copies of an allele inherited from a common ancestor) is 19%. Furthermore, if these two dogs were to produce a litter, the predicted coefficient of the puppies would average 19%.

Computed from a pedigree, the kinship coefficient is an estimate of the average expected kinship coefficient; that is, the shared genetic relatedness because of shared ancestry. But kinship can also be determined directly from DNA genotyping data, such as is provided by Embark. (As far as I know, this is the only company that will allow dog owners to download the raw data for their dogs.) When based on DNA, these are "realized" rather than predicted estimates of genetic relatedness, and they will be different for every dog in a litter.
​
Now, here's the beauty of this. Let's say you're looking for a dog that will be an outcross for a bitch you want to breed, and you're willing to import a dog if you have to. You have computed the kinship coefficients from the pedigree database available for your breed, and there are two dogs overseas - litter mates, in fact - that look promising. Would these dogs be a good outcross for your bitch? Would one of these be a better genetic fit to the bitch than the other?

To answer these questions, you can do direct comparisons of the genomes of these two dogs with the bitch you want to breed by calculating the kinship coefficient for both of the sire-dam pairs. Modern DNA analysis using "single nucleotide polymorphisms" (SNPs) can now provide excellent data with very high resolution that you can use to do this. ("Single nucleotide polymorphism" is a fancy term for loci that are highly variable ("polymorphic"); the abbreviation is pronounced "snips".) We can easily and inexpensively compare hundreds of thousands - even millions - of loci on the chromosomes of a pair of dogs, assess whether the alleles at each of those loci are the same or different. Further, using data for allele frequencies in the larger population we can determine if the shared SNPs are copies of the same allele in a common ancestor; that is, they are "identical by descent" (IBD). This is the technique used for establishing the relationships among many breeds of dogs (Dreger et al 2016), and it is also used to identify genetic mutations associated with diseases in genome-wide-association studies (GWAS).

Instead of estimating kinship from a pedigree database, which will only give you one number that applies to the entire litter, you can estimate the actual degree of genetic similarity between two dogs. In fact, using SNPs you can even see which areas on each chromosome are shared. You can use this information to see if blocks of homozygosity overlap in two dogs, in which case all of the offspring would also be homozygous in the same place. (More on this in an upcoming blog post!) You can specifically look at characteristics of the genome of the two litter mates and determine if there are any ways one might be a better match to your bitch than another. And the kinship coefficient will also tell you the estimated inbreeding coefficient of the litter produced by each potential sire. 

For the preservation breeder, the genomic kinship coefficient from SNP genotype data provides you with the best, most advanced tool available today for genetic management to improve the quality of your puppies while also protecting genetic diversity for the health of your breed in the future. 

We will be learning about kinship coefficients and how to use the kinship matrix in ICB's new course, "Strategies for Preservation Breeding", which starts 10 September 2018. Join other preservation breeders who will be using this powerful tool to improve their breeding program. If you're interested in using genomic kinship coefficients to explore options for your next breeding, contact ICB and we will work with you to set that up. 

Watch this space for more Cool Things you can do with kinship coefficients!


REFERENCES

Dreger, DL, M. Rimbault, BW Davis, A Bhatnagar, HG Parker, & EA Ostrander. 2016. Whole-genome sequence, SNP chips and pedigree structure: building demographic profiles in domestic dog breeds to optimize genetic trait mapping. Disease Models and Mechanisms 9: 1445-1460. (pdf)

Hayward, JL, MG Castelhano, KC Olivera, and others. 2016. Complex disease and phenotype mapping in the domestic dog. Nature Communications 7:10460. DOI: 10.1038/ncomms10460. (pdf)

Li, M-H, I Stranden, T Tiirikka, M-J SevonAimonen, & J Kantanen. 2011. A comparison of approaches to estimate the inbreeding coefficient and pairwise relatedness using genomic and pedigree data in a sheep population. PLoS ONE: Nov 2011; Vol 6:11. e26256. (pdf)

Learn how you can use kinship coefficients in
​this terrific new ICB course!


NEW COURSE!

Strategies for Preservation Breeding

Starts 10 September 2018

15 weeks, $189

Join us!

To learn more about the genetics of dogs, check out
ICB's online courses

***************************************

Visit our Facebook Groups

ICB Institute of Canine Biology
...the latest canine news and research

ICB Breeding for the Future
...the science of animal breeding

    Archives

    January 2025
    November 2022
    July 2022
    May 2022
    April 2022
    March 2022
    February 2022
    November 2021
    October 2021
    December 2020
    January 2020
    August 2019
    July 2019
    June 2019
    May 2019
    April 2019
    March 2019
    February 2019
    January 2019
    December 2018
    November 2018
    September 2018
    August 2018
    July 2018
    June 2018
    May 2018
    October 2017
    August 2017
    May 2017
    April 2017
    March 2017
    February 2017
    January 2017
    December 2016
    November 2016
    September 2016
    August 2016
    July 2016
    June 2016
    April 2016
    March 2016
    February 2016
    January 2016
    December 2015
    November 2015
    October 2015
    September 2015
    August 2015
    July 2015
    June 2015
    May 2015
    April 2015
    March 2015
    January 2015
    December 2014
    November 2014
    October 2014
    September 2014
    August 2014
    July 2014
    June 2014
    May 2014
    February 2014
    December 2013
    October 2013
    September 2013
    July 2013
    March 2013
    July 2012
    April 2012

    Categories

    All
    Behavior
    Border-collie
    Herding

Blog

News


About Us

Contact Us


Copyright © 2012-2017 Institute of Canine Biology
Picture
Picture