By Carol Beuchat PhD
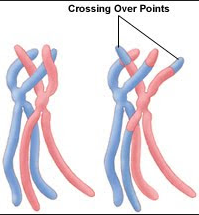
Genetics has been revolutionized in the last decade by the development of amazing new technology. For decades, geneticists relied on markers called microsatellites, which are stretches of DNA with repeated element that can differ from individual to individual. In closely related animals, the repeated pattern would be similar, whereas the pattern would be more and more dissimilar in animals that are less related.
How SNP technology is revolutionizing genetics
Our ability to resolve genetic relationships among individuals has been revolutionized by technology that can identify hundreds of thousands, or even millions, of DNA markers. Distributed densely over all of the chromosomes, these markers, called SNPs (pronounced "snips"), can reveal present genetic relationships in fine detail. Even more amazing, SNPs can tell us about genetic history - what carnivores are the dog's closest relatives, where the world's dog populations originated, what breeds were used in the creation of new breeds by crossbreeding, and even how long in the past a cross-breeding occurred. The amount and quality of information is breathtaking, and the study of canine genomics has been changed forever. This SNP technology is referred to as "Next Generation Sequencing" (NGS), because it truly did propel genomics into the "next generation".
Our ability to resolve genetic relationships among individuals has been revolutionized by technology that can identify hundreds of thousands, or even millions, of DNA markers. Distributed densely over all of the chromosomes, these markers, called SNPs (pronounced "snips"), can reveal present genetic relationships in fine detail. Even more amazing, SNPs can tell us about genetic history - what carnivores are the dog's closest relatives, where the world's dog populations originated, what breeds were used in the creation of new breeds by crossbreeding, and even how long in the past a cross-breeding occurred. The amount and quality of information is breathtaking, and the study of canine genomics has been changed forever. This SNP technology is referred to as "Next Generation Sequencing" (NGS), because it truly did propel genomics into the "next generation".
For many years, SNP technology was very expensive and beyond the reach of the layperson. But the cost has come down dramatically in the last few years, and you can now send off a sample of spit to any of a number of companies that will tell you where your ancestors lived, which of your genes are links to particular traits or diseases, and even the nationalities in your background. What started as "recreational" genomics is now driving advances in diagnosis and treatment of diseases.
SNP technology offers some amazing opportunities to learn about the genes in dogs. Companies are popping up that offer to identify the breeds in a mix (some with better success than others). For breeders, high resolution SNP genotyping is providing data that can be used with powerful analysis tools in molecular biology and population genetics to improve our ability to select for the traits we want and against the ones we don't more efficiently than ever before. In fact, livestock breeders can now take a DNA sample from an animal at birth and know the traits the animal will have as an adult. Could we be using these techniques to breed better dogs?
How we can use SNP genotyping to manage genetic disease
We can use the power of high resolution SNP analysis to reveal the details of genetic relationships among animals. A potential sire that might look like an outcross to your bitch on paper can instead be very similar genetically because of relationships among ancestors many generations back in the pedigree. When you are choosing a sire to improve a trait, reduce the risk of genetic disease, or increase the genetic diversity in your line, reliable information about the DNA in the dogs can be the difference between success and failure. Let's look at an example of how we can use information about genetic relationships to manage a genetic disorder in dogs.
We can use the power of high resolution SNP analysis to reveal the details of genetic relationships among animals. A potential sire that might look like an outcross to your bitch on paper can instead be very similar genetically because of relationships among ancestors many generations back in the pedigree. When you are choosing a sire to improve a trait, reduce the risk of genetic disease, or increase the genetic diversity in your line, reliable information about the DNA in the dogs can be the difference between success and failure. Let's look at an example of how we can use information about genetic relationships to manage a genetic disorder in dogs.
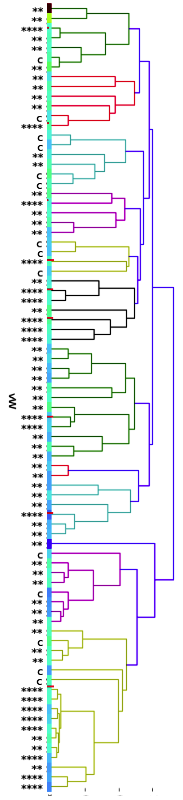
An organization breeding Labradors for guide dogs was having a problem with elbow dysplasia (ED) (Ubbink et al 1998). They had good pedigree records and used these to map the genetic relationships among the dogs in their breeding stock using kinship to determine relatedness and a technique called cluster analysis to form clusters of related dogs.
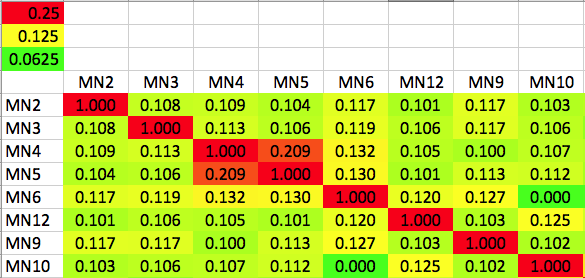
This is a "dendrogram", a diagram similar to the branches of a tree that displays the genetic relationships among animals. On the right side of the chart is a numeric scale of relatedness. The shortest branches indicate the highest similarity between individuals; so the very short branches at the level of 0.125 (red arrow), reflect relatedness comparable to a half-sib mating. The next number, 0.0625, corresponds to the relatedness (inbreeding) produced by mating first cousins, and the numbers above that correspond to successively lower degrees of relatedness.
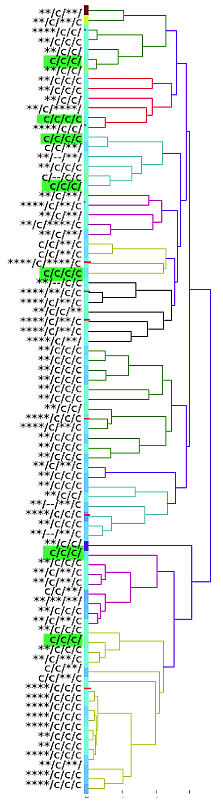
| After creating this map of the relatedness of the dogs in their breeding colony, the number of dogs with ED was indicated by shading the bar of that group. This clearly revealed that the dogs with ED were closely related and clustered together in one region of the map. Using this information based on genetic relatedness, ED could be reduced by identifying the unaffected dogs that were at high risk because they belonged to genetic clusters containing affected dogs - and without knowing anything at all about the genes involved or mode of inheritance. This analysis was done in 1998, not using a fancy modern DNA test, but a carefully-tended pedigree database. The limitation of using pedigrees for the general population of purebred dogs is that they are often incomplete, they can (and surely do) contain errors, and often are not even available. | 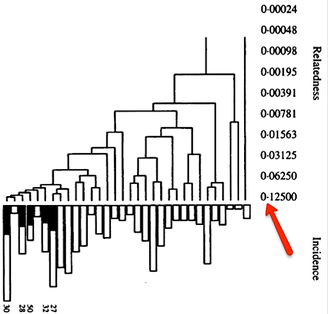 |
But now using genomic data, we can reconstruct the genetic relationships among the individuals in a population of dogs with no information at all about pedigree history. While this technique is not conceptually new, it has not been used by breeders. This could truly revolutionize the way we manage genetic diseases in dogs.
Using SNP genotyping to map genetic relationships
Many breeds are highly inbred and have low genetic diversity. Will this technique using DNA to establish genetic relatedness work for purebred dogs?
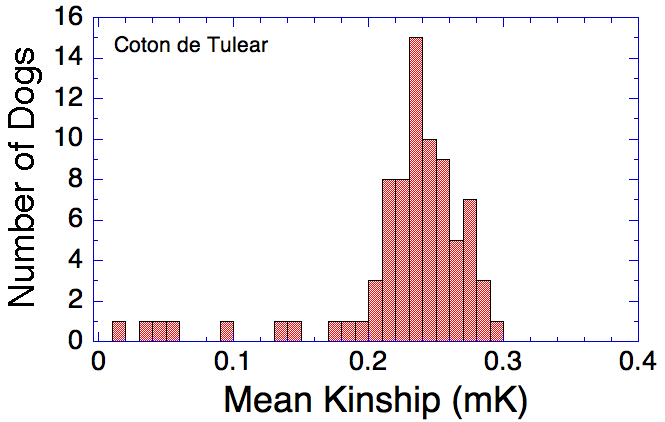
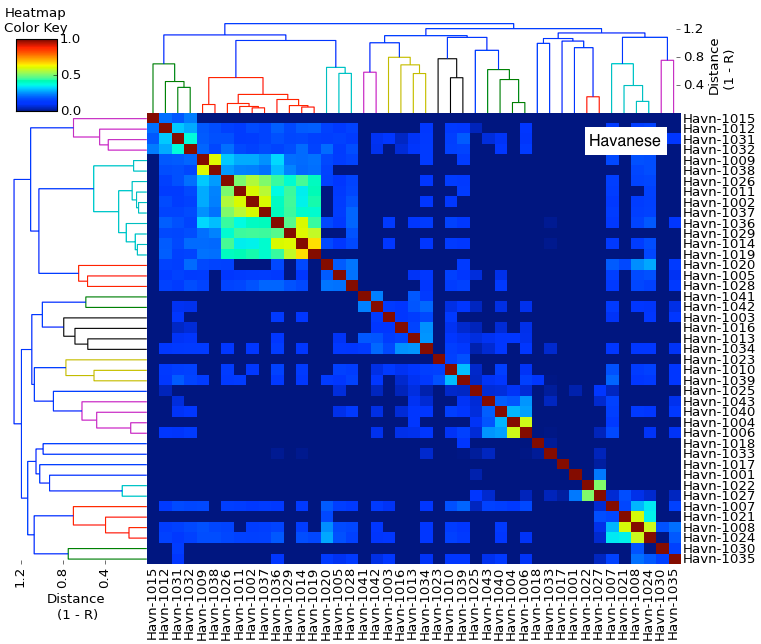
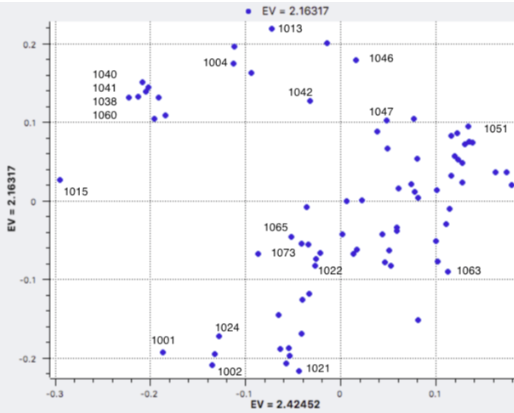
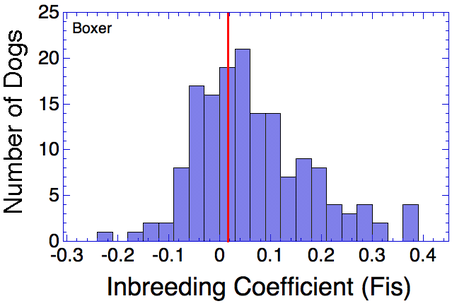
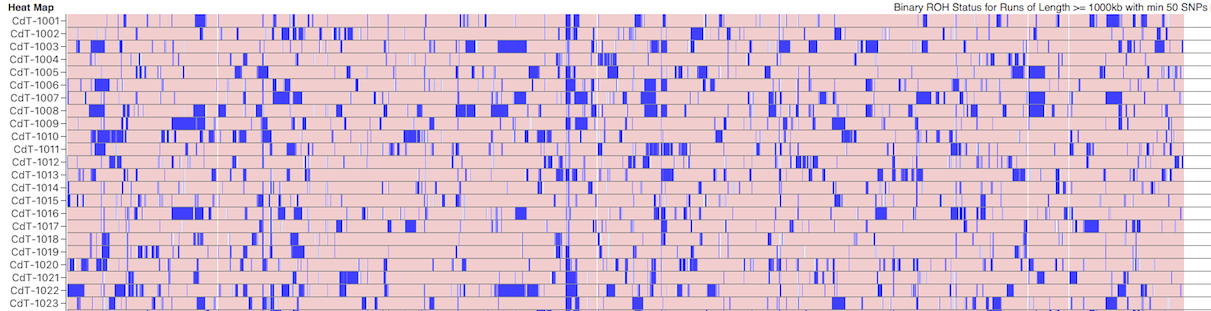
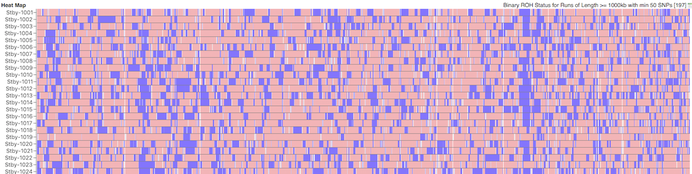
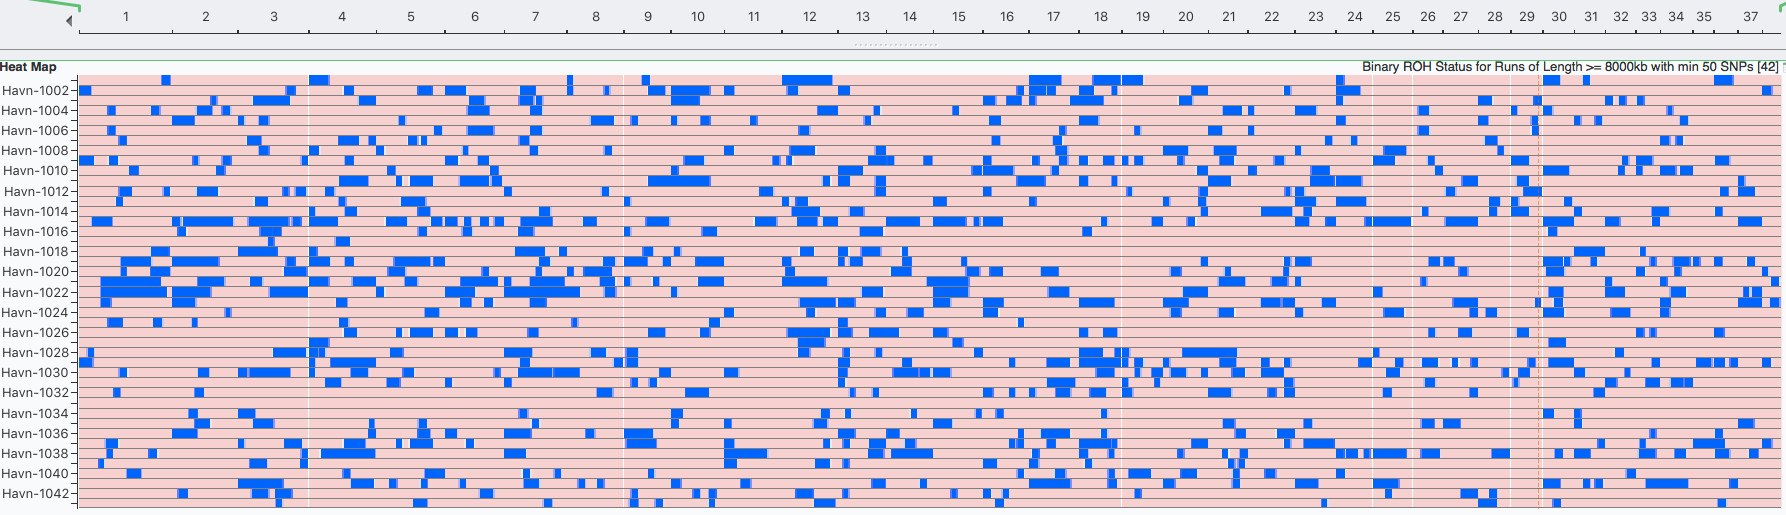
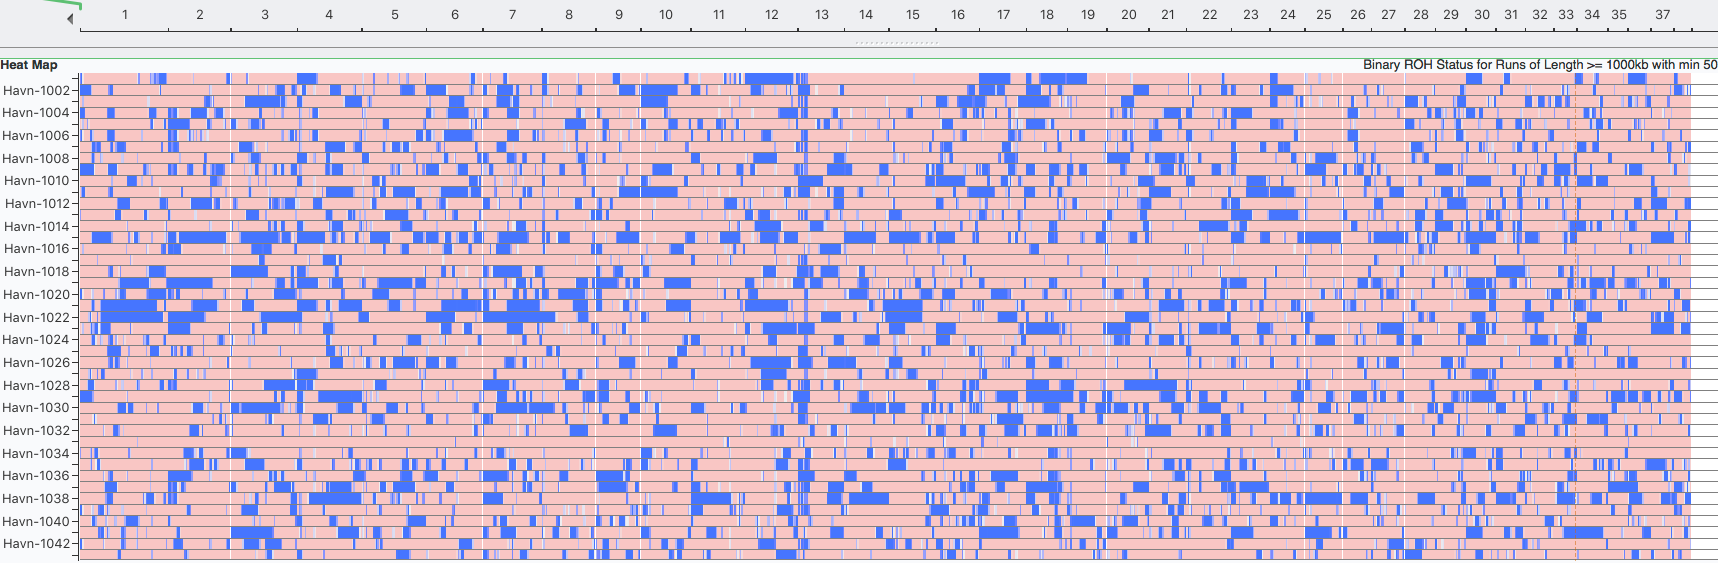
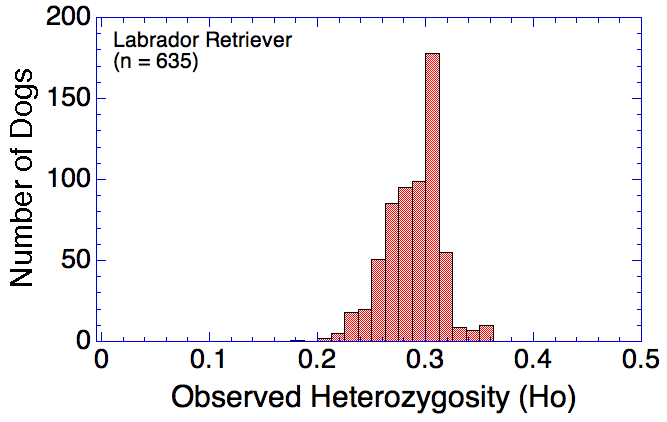
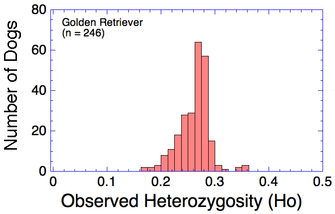
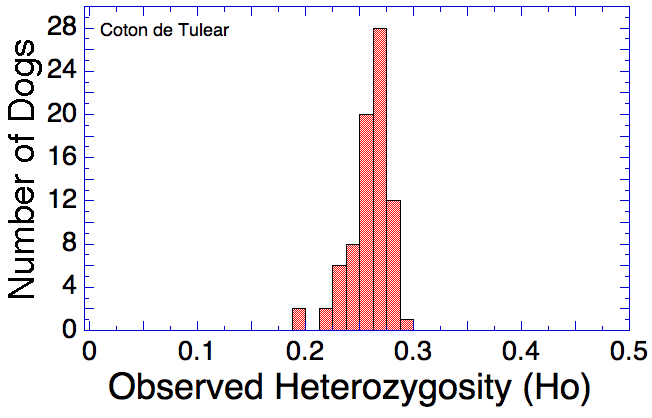
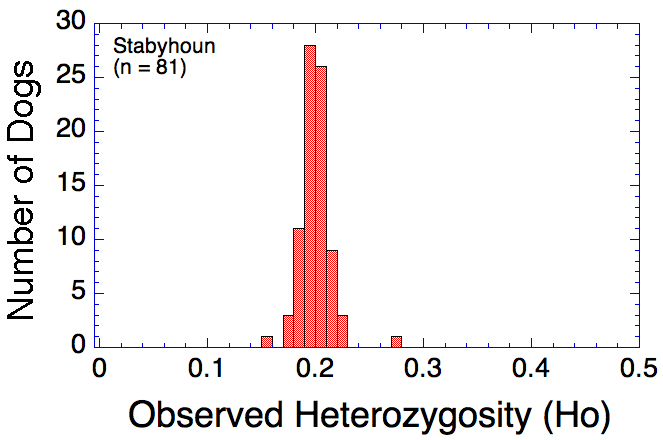
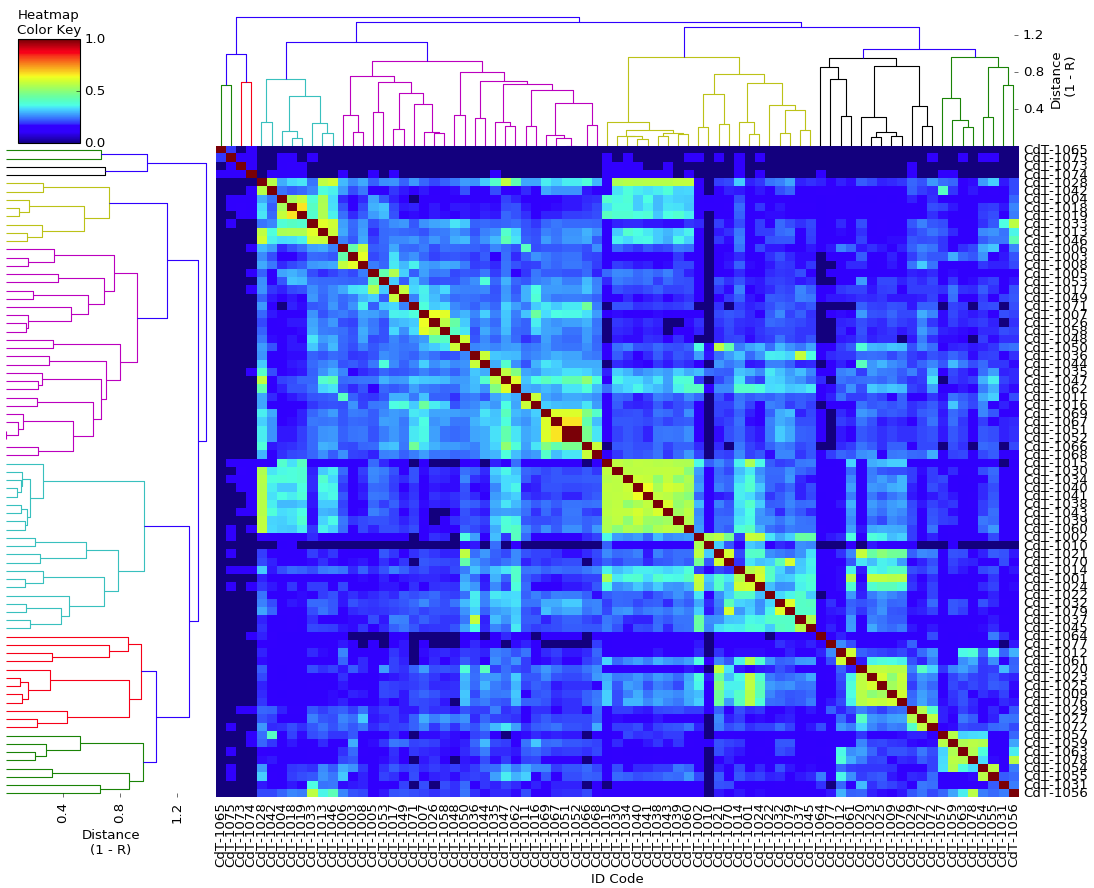
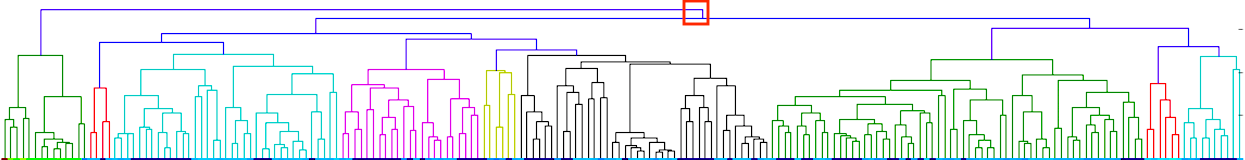
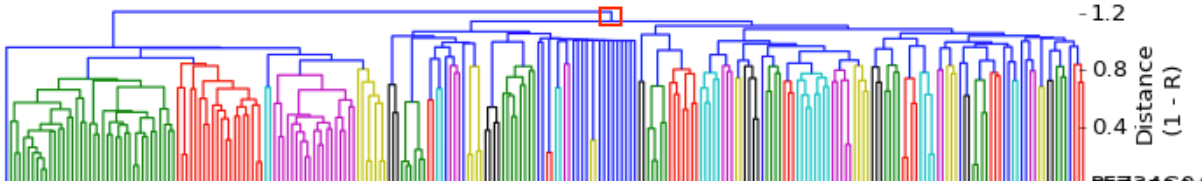
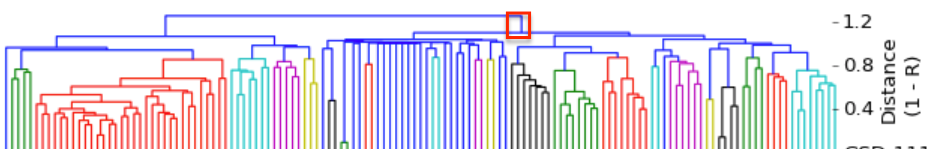
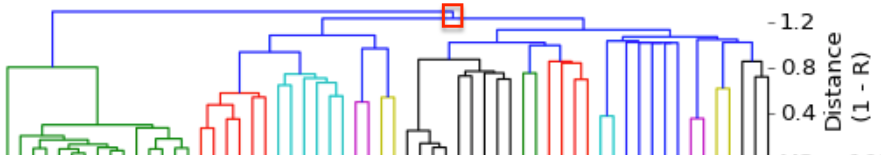
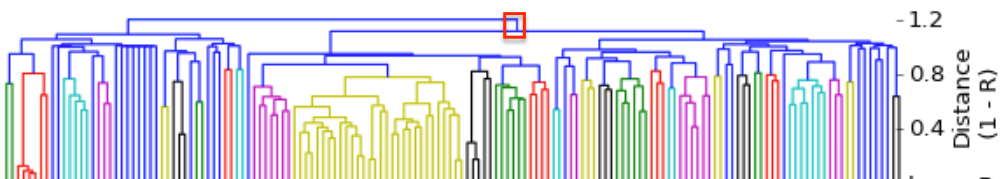
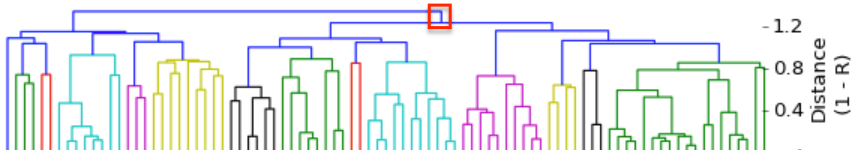
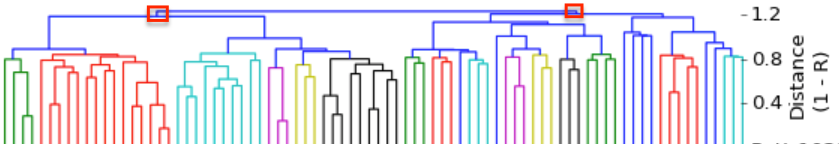
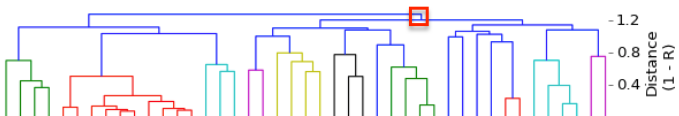
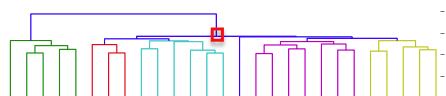
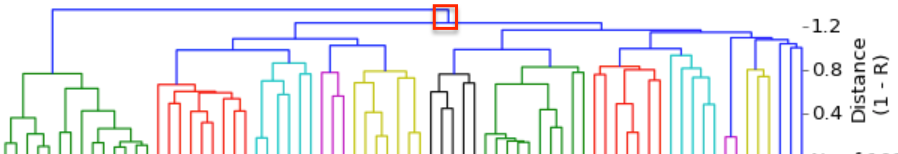
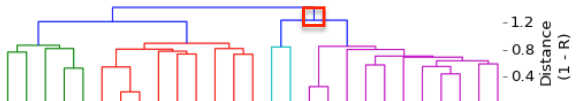
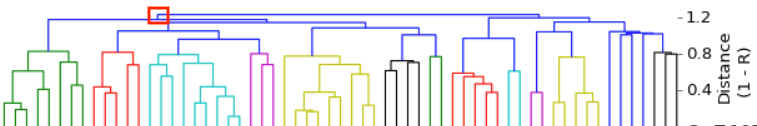
I have gathered some DNA data in public archives from published studies that were analyzed using high density SNP genotyping, then used cluster analysis (as was done above) to produce the map of genetic relatedness for a number of breeds. These are displayed below, and many show that there are genetically distinct subpopulations within a breed that could be exploited to look for patterns in the expression of genetic disorders. We know nothing about who these dogs are, but the charts show that there is sufficient genetic differentiation in a breed to use for this type of analysis. On each one I have indicated with a red square the first major division to make it easier for you to visualize the groups. For some of these we clearly need more data, and for all of them we need data for known dogs. But this should give you a good idea of what some of these look like.
Many breeds are highly inbred and have low genetic diversity. Will this technique using DNA to establish genetic relatedness work for purebred dogs?
I have gathered some DNA data in public archives from published studies that were analyzed using high density SNP genotyping, then used cluster analysis (as was done above) to produce the map of genetic relatedness for a number of breeds. These are displayed below, and many show that there are genetically distinct subpopulations within a breed that could be exploited to look for patterns in the expression of genetic disorders. We know nothing about who these dogs are, but the charts show that there is sufficient genetic differentiation in a breed to use for this type of analysis. On each one I have indicated with a red square the first major division to make it easier for you to visualize the groups. For some of these we clearly need more data, and for all of them we need data for known dogs. But this should give you a good idea of what some of these look like.
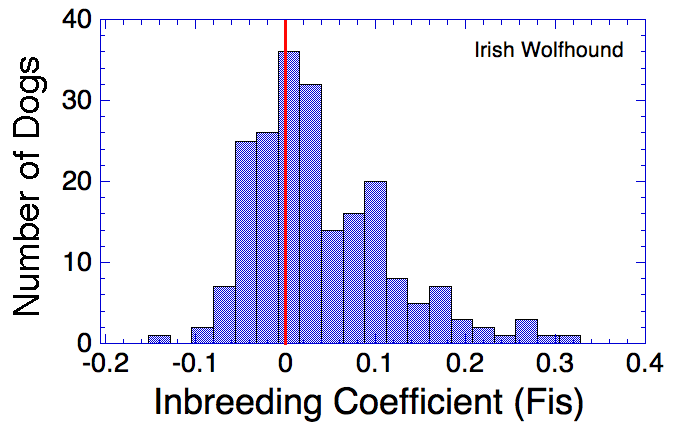
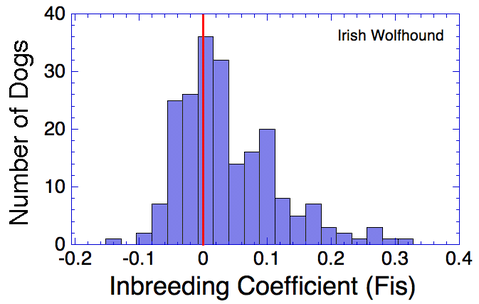
Irish Wolfhound
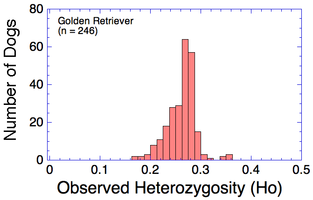
Golden Retriever
German Shepherd
Miniature Schnauzer
Boxer
Vizsla
Rottweiler
Havanese
Bernese Mountain Dog
Newfoundland
French Bulldog
Cairn Terrier
Can we do this for your breed?
Here we describe a very powerful technique to sort out genetic relationships among individuals that can be used to improve genetic management of disorders without knowing the genes involved. There is a long list of inherited disorders that breeders are struggling to manage in the absence of genetic information for guidance. Epilepsy, cancer, heart disorders, kidney disease, neurological problems, degenerative myelopathy, and the list goes on and on. We're not making much progress.
We can do this now. We need DNA genotype data for current dogs, including those in the breeding population, to establish the genetic subgroupings within the breed. We need the incidence data for the disorders of interest.
It might not take a lot of data to reveal the information we need. In the example of Laboradors above, data from just a few dogs would indicate the location of the cluster containing the affected dogs. You could take action using this information far sooner than if you needed 20 affected and 20 clear dogs to search for genes.
If you're interested in using this powerful technique for your breed, please contact us. We can set up a Genetic Management Workshop for your breed where breeders and PhD population geneticists with expertise in canine genomics and breeding can discuss goals and resources, and work together to develop a breeding plan to address problems.
We now have amazing tools to help breeders manage the growing list of genetic disorders in dogs. Let's use them!
To learn more about the genetics of dogs, check out
ICB's online courses
***************************************
Visit our Facebook Groups
ICB Institute of Canine Biology
...the latest canine news and research
ICB Breeding for the Future
...the science of animal breeding
ICB's online courses
***************************************
Visit our Facebook Groups
ICB Institute of Canine Biology
...the latest canine news and research
ICB Breeding for the Future
...the science of animal breeding