A DNA PRIMER FOR DOG BREEDERS
ICB Breeder Tool Quick Start Guide
POPULATION LEVEL ANALYSES
1) Measures of Genetic Diversity
Observed Heterozygosity (Ho)
| Inbreeding (breeding of related animals) results in homozygosity, in which an individual inherits two copies of the same allele from an ancestor (e.g., AA or aa). The opposite of homozygosity is heterozygosity, in which an animal inherits two different alleles (version of a gene). Observed Heterozygosity: higher numbers are better | 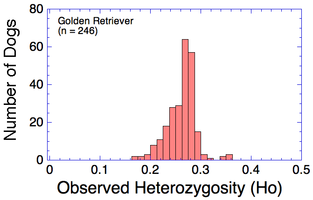 |
Genomic Inbreeding (F)
| An estimate of inbreeding can be computed from a pedigree database. Inbreeding can also be estimated directly from DNA data as genomic inbreeding. It can be determined as the fraction of the genome that is homozygous (the "realized" inbreeding) from "runs of homozygosity" (ROH). F of 0.2 corresponds to an inbreeding coefficient of 20%. Genomic Inbreeding (F): lower numbers are better | 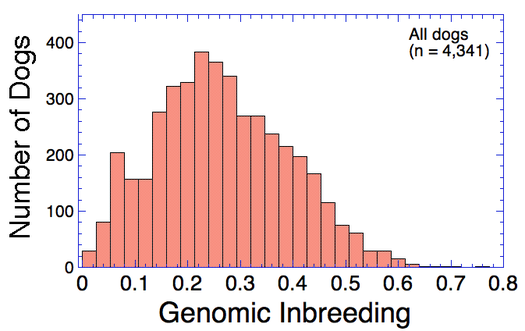 |
Genomic Inbreeding (Fis)
| With information about allele frequencies in a population from SNP data, inbreeding can be assessed relative to what would be expected in a randomly breeding population. If zero is the expected inbreeding under random mating, positive values of Fis indicates preferential inbreeding ("excess" homozygosity) and negative values of Fis indicate preferential outbreeding. Genomic Inbreeding (Fis): lower, negative numbers are better | 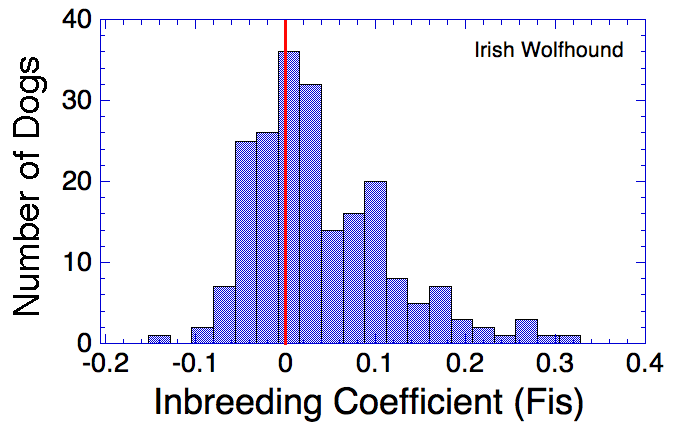 |
2) Measures of Relatedness
| Kinship Coefficient (K) The degree of genetic similarity between two individuals due to common ancestry is the kinship coefficient (K). The kinship coefficient of a sire and dam is also the predicted coefficient of inbreeding of their offspring. For full siblings from unrelated parents K would be 0.25, and their offspring would have an inbreeding coefficient of 25%. A kinship matrix displays the Kinship Coefficient of each individual with all others in the population. This matrix is a color coded "heat map" in which red indicates K > 0.25, yellow is K = 0.125, and green is K = 0.625. These correspond to full siblings, half siblings, and first cousins, respectively. (See "How to read a heat map".) Kinship coefficient (K): lower numbers are better | Kinship Matrix 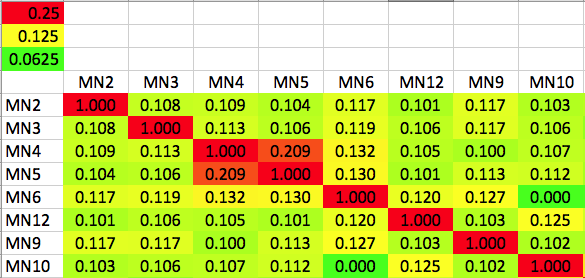 |
| Mean Kinship (mK) The degree of relatedness of animals in a population can be assessed as the average of the kinship of an individual with every other member of the population (mean kinship, mK). Individuals that are least related to the rest of the population will have the lowest mK. Individuals that have many relatives in the population will have a high mK. Mean kinship (K): lower numbers are better | 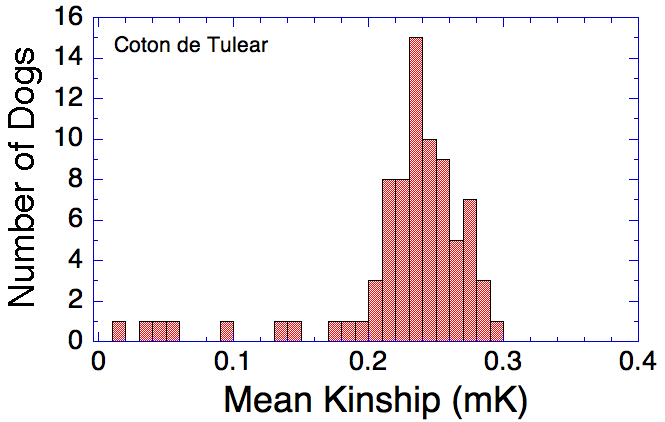 |
| Genetic Relationships The genetic relationships among the animals in a population can be determined using the kinship coefficient, K, which reflects the alleles that are identical by descent (i.e., from common ancestors). Genetic relationships are displayed as a dendrogram, the "family tree". Animals that are more closely related are connected by shorter branches. Relatedness is also indicated by the colors in the "heat map", in which blue is least related and red is most closely related. (See "How to read a heat map" and "How to read a dendrogram".) Dendrogram: shorter branches indicate closer relationship | 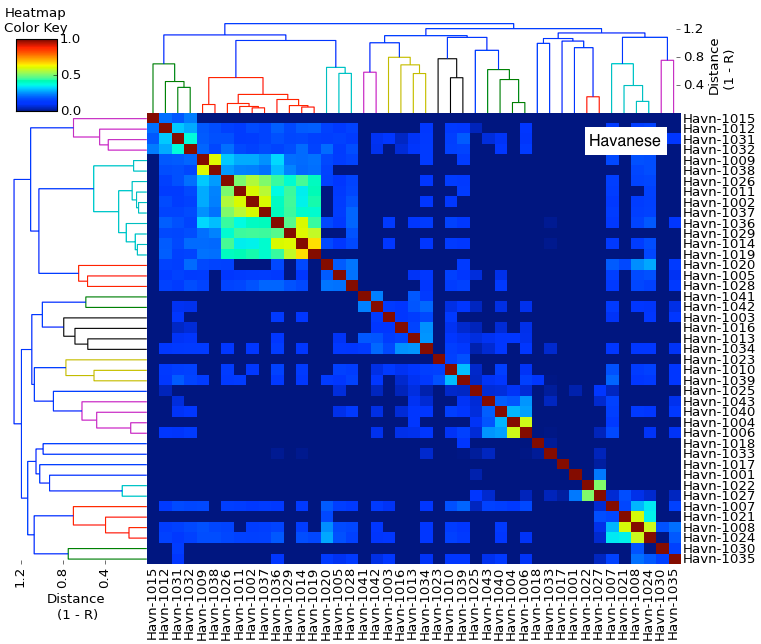 |
3) Population Structure
| Principal Components Analysis (PCA) PCA is a statistical technique for revealing similarity of individuals, which doesn't necessarily correspond to relatedness. The genetic difference between two individuals is the length of a line that connects them on the graph ("genetic distance"). This can be used to visualize subpopulations of animals; e.g., field vs show dogs, European vs Canadian dogs. Principal Components Analysis (PCA): similar individuals are closer together | 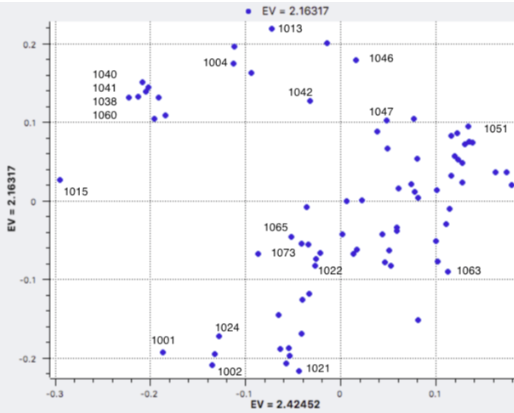 |