The Institute of Canine Biology
  • HOME
  • Blog
  • Courses
    • COI BootCamp (FREE!)
    • Basic Population Genetics (FREE)
    • The Science of Canine Husbandry
    • Managing Genetics For the Future >
      • Syllabus - Managing Genetics for the Future
    • The Biology of Dogs (Open Reg )
    • DNA For Dog Breeders >
      • Syllabus - DNA for Dog Breeders
      • Open Reg - DNA For Dog Breeders
    • Understanding Hip & Elbow Dysplasia >
      • Open Reg - Understanding Hip & Elbow Dysplasia
    • Genetics of Behavior & Performance >
      • Syllabus - Genetics Behavior & Performance
      • Open Reg - Genetics of Behavior & Performance (Open Reg)
    • Strategies for Preservation Breeding >
      • Open Reg - Strategies for Preservation Breeding
    • Group Discounts
    • MORE FREE COURSES >
      • Quickie Genetics (Free!)
      • Heredity & Genetics (Free!)
      • Useful Genetics (Free!)
      • Basic Genetics Videos
  • Breed Preservation
    • Breed Status
    • Breeding for the future >
      • BFF Breed Groups
    • The "Elevator Pitch"
    • What's in the Gene Pool?
    • The Pox of Popular Sires
    • What population genetics can tell us about a breed
    • What population genetics can tell you...Tollers & Heelers
    • How to use kinship data
    • Using EBVs to breed better dogs >
      • How population size affects inbreeding
      • EBV Examples
    • How to read a dendrogram
    • Global Pedigree Project >
      • The Database
    • Finding the genes without DNA
    • How to read a heat map
  • Health Data
    • Bloat (Purdue Study)
    • Body Condition Score >
      • % Dysplastic vs BCS
    • Breed Comparions
    • Cancer
    • Cardiac
    • Cataracts
    • Caesareans
    • Deafness
    • Degenerative Myelopathy
    • Elbow Dysplasia
    • Epilepsy
    • Genetic Diversity
    • Genetic Diversity (MyDogDNA)
    • Hip Dysplasia >
      • Hip Dysplasia (Hou et al 2013)
    • Inbreeding Effects
    • Inbreeding (Gubbels)
    • Inbreeding (Dreger)
    • Lifespan
    • Litter size
    • Metabolic
    • mtDNA
    • Orthopedic
    • Mode of Inheritance
    • Patella Luxation
    • Thyroid
    • Portosystemic shunt
    • Purebred vs Mixed (UC Davis)
    • Purebred vs Mixed Breed (Bonnett)
    • Spay & Neuter Effects
    • Calboli et al 2008
    • Hodgman (1963)
    • Scott & Fuller (1965)
    • Stockard: Purebred crosses
    • Summers (2011)
  • Projects
    • How To Interpret Breed Analyses
    • Afghan Hound
    • More details about the Toller study
    • Belgian Tervuren >
      • Belgian Terv p2
      • Belgians- why population size matters
    • Bernese Mountain Dog
    • Boxer
    • Brussels Griffon
    • Bullmastiff
    • Canaan Dog >
      • Canaan analyses
    • Cesky Terrier >
      • Cesky genetic history
    • Chinook
    • Curly-coated Retriever
    • Doberman
    • Entelbucher Mountain Dog
    • Flatcoat Retriever
    • French Bulldog
    • German Shorthair
    • Golden Retriever >
      • Golden Retriever Pedigree Charts
    • Irish Water Spaniel >
      • IWS (6 Nov 17)
    • Labrador Retriever
    • Manchester Terrier
    • Mongolian Bankhar >
      • Research Updates
      • Bankhar 1
    • Norwegian Lundehund
    • Plummer Terrier
    • Otterhound
    • Portuguese Water Dog >
      • Portuguese Water Dog (pt 2)
    • Ridgeback
    • Schipperke
    • Standard Poodle >
      • The Problem With Poodles
      • 3poodle pedigree charts
      • 3Poodle Wycliff dogs
      • Poodle Genetics
    • Tibetan Spaniel
    • Tibetan Mastiff
    • West Highland White Terrier
    • Whippet
    • Wirehaired Pointing Griffons
    • UK KC Graphs >
      • UK KC Breed Status
      • UK Groups
      • KC Gundogs
      • KC Hounds
      • KC Terriers >
        • Terriers (select breeds)
      • KC Pastoral
      • KC Toys
      • KC Working
      • KC Utility
      • Australian KC
    • Breed outcrossing programs
  • Resources
    • Genetics Databases
    • Stud Books >
      • American Kennel Club stud books
      • Field Dog stud books
      • The Kennel Club (UK)
    • Learn
    • Videos about dog genetics
    • The Amazing Things Dogs Do! (videos) >
      • Livestock Management
      • Livestock guarding
      • Transportation, exploration, racing
      • Conservation & wildlife management
      • Detection Dogs
      • Medicine & Research
      • Entertainment
      • AKC/CHF Podcasts
    • Read & Watch
    • Bookshelf
  • Preventing Uterine Inertia

It's not always as simple as dominant and recessive

10/31/2014

 
by Carol Beuchat PhD

One of the first things most breeders learn about genetics is the difference between dominant and recessive alleles. Most people understand that dominant alleles are expressed whether there is one or two copies at a locus, whereas recessive alleles are only expressed if there are two copies of that allele. This clear difference between dominant and recessive expression is certainly true for some genes, but in reality the situation can be much more complex. Perhaps you have heard terms such as "incomplete dominant", "co-dominant", or "semi-dominant". Are these different types of alleles than the basic dominant and recessive? Or is there some other condition that makes these alleles function differently? There is lots of confusion about this, and often people resort to one of the "incomplete", "co-", or "semi-" terms to describe anything that doesn't behave like a simple dominant or recessive. These terms refer to differences in phenotypes, but what's  going on at the level of the gene?

Here is a nice little video that explains the complexity of these differences in the expression of genes as phenotypes, from the "Useful Genetics" online course taught by Dr Rosemary Redfield (Univ. British Columbia). She gives a nice explanation of the terms, and explains why the descriptions of gene expression such as "semi" or incomplete" incorrectly imply that these reflect functional differences among genes, when in fact they are only descriptors of phenotype that result from the interactions and relationships among genes.

Spend 15 minutes with this video and clear the fog about dominant and recessive. Enjoy!
All About Dominance

Useful Genetics: Dr Rosie Redfield, The University of British Columbia.
Click to set custom HTML
This video is licensed under a Creative Commons Attribution-Share Alike 3.0 Unported license.
You can view the entire course "Useful Genetics" on the ICB course site.

Check out ICB's online courses and our Breeding for the Future Facebook group!

The fiction of "knowing your lines"

10/26/2014

 
by Carol Beuchat PhD

Today I found yet another study that identifies a recessive mutation that has popped up out of nowhere to ruin the lives of some Labrador Retriever puppies with congenital myasthenic syndrome. It occurred in a pair of littermates from parents with two recent common ancestors. The investigators also examined relatives of these dogs and found 16 of 58 carried the mutation - that's almost 30% - while 288 unrelated Labradors carried the normal gene.

The authors say that "Linebreeding in this Labrador Retriever family makes it likely that the sire and dam inherited the mutation from a common ancestor and that the affected puppies are homozygous for a chromosome segment transmitted IBD" (identical by descent)... "Linebreeding practices expedite the appearance of recessive diseases in purebred populations."

Let me make this crystal clear.

This particular family of dogs carries a mutation that causes a serious genetic disorder, in this case the mechanism that allows nerves talk to muscles is broken in dogs that get two copies of the defective gene. Dogs with only one copy apparently are fine. Two related dogs were bred, both as it turns out were carriers, and they produced puppies with problems. However well this breeder might "know their lines", there was no way to know that this gene was lurking in this line of dogs.

Coefficient of inbreeding is the probability of inheriting two copies of the same gene from an ancestor on both sides of a pedigree. The higher the COI, the greater the risk of having something like this happen.  ALL dogs have mutations that the breeder has no way of knowing about. If this was a "responsible" breeder, they would have done the available DNA tests for the disorders known in Labradors. They could be certain of not producing puppies with any of those. But then they did a close breeding, and whoopsie, ran into this.

It's the mantra of the experienced breeder: "Know your lines." That is certainly good advice for the things that CAN be known, but there seems to be little appreciation for the fact that there are many things that you CANNOT know. The only way to manage the unknowns is by breeding in a way the manages the risk of finding out the hard way what those silent mutations are. This is what I argued in an earlier essay about why DNA testing is not going to solve the genetic problems in purebred dogs if breeders DNA test then inbreed. Just the other day I was reading a long discussion among breeders about inbreeding/linebreeding, and several breeders were swearing that they "knew their lines" and that's why they can linebreed without the genetic problems that other (less experienced?) breeders are complaining about. 

I don't know if these people truly believe the fiction that there are no problems in their lines, or perhaps the more serious myth that they can inbreed yet avoid genetic problems because of their great skill as breeders (and "knowing" those lines). What will it take to convince breeders that it's only a matter of time - the landmines are out there, and one of these days what appears to be a clear path is going to reveal them. Guaranteed.

I'm sick of reading these papers about yet another "new" genetic disease in dogs caused by a recessive mutation that has become a problem because of inbreeding/linebreeding. I'm sick of reading posts from breeders who proclaim that skill, experience, and "knowing my lines" allows them to breed closely related dogs without consequence, when in fact they are intimately involved in a dangerous game of roulette in which, sooner or later, the loser will be a puppy and the family with a broken heart that owns it.

  • Rinz CJ, J Levine, KM Minor, HD Humphries, R Lara, AN Starr-Moss, LT Guo, DC Williams, GD Shelton, & LA Clark 2014 A COLQ Missense mutation in Labrador Retrievers having congenital myasthenic syndrome. PLoS One 9(8): e106425. (pdf)

Is your breed drifting?

10/24/2014

 
by Carol Beuchat PhD

  • This is an exercise straight out of one my courses, Basic Population Genetics for Dog Breeders, but it is so important for breeders to understand that I'm making it available here. Please take the time to work your way through it. There are some simple simulations you do with colored "alleles", then some computer simulations where you can do some experiments that will allow you to explore the factors that can affect your breed's gene pool in ways you wouldn't expect. These simple exercises will change the way you view the genetic stability of your breed - I promise. This might be a fun thing to do the next time you get together with a group of fellow breeders.

    Things to think about when you're done -
    • How big is your breed - not in total numbers of dogs, but in the size of the breeding population?
    • What fraction of the dogs in your breed are allowed to breed?
    • Does your breed have restrictions in the standard that remove dogs from the breeding population?
    • Do you have breeding restrictions on the puppies you place?
    • Is your breed relatively unpopular or dominated by just a few kennels?
    • How vulnerable is your breed to genetic drift?

For this week's lesson, you need something that you can use to simulate two alleles.  Red and white beans will do (they're cheap and you can eat the experiment when you're done), but anything similar will do - marbles, beads, or if you want to stick to the pseudo-nutritional - M&M, JellyBellies, Skittles...

You probably know that for every gene location -­‐ a locus -­‐ an animal has two alleles, one that came from the sire and one from the dam. Which one of the two alleles gets passed on to each offspring is random, so the pair of alleles that the offspring inherits for each gene is determined only by chance.

The Binomial Situation
Take out a coin. Every coin has two sides -­‐ heads and tails -­‐ and for this reason when we flip a coin we are talking about binomial probability. If it's a fair coin, there is a 50:50 chance of getting heads every time you flip it. You might get 5 heads in a row, but nevertheless at the next toss the chance of getting a heads is one out of two.

If you only flip it once and get heads, then the outcome of the trial is 100% heads. If you flip it 5 times and get 4 heads and 1 tails, then the outcome of the trial is 80% heads. If you flip it 100 times, or 1000 times, the probability of getting an extreme result goes down, and it should tend towards 50:50. This is the basis of the "bell curve" -­‐ most of the results will be close to 50:50 and deviations from this will become rarer as they become more extreme.

What does this have to do with dog breeding? Remember, which of the two possible alleles an offspring inherits from each parent is determined randomly -­‐ but when there are only a small number of "trials" (puppies in this case), the results could be extreme just by chance. This is relevant to dogs because in terms of "large" vs "small", the typical size of a litter is small.  Because litters are statistically small, extreme results from a binomial sampling can occur.

Simulating Binomial Sampling With Beans
It's easy to demonstrate what we're talking about here. I'm sure you understand the example of the coin toss (or if you didn't, get out a coin and do some tossing). Let's do the same sort of thing, but now using beans to represent the alleles a dog could inherit at a particular locus.

This is where you get to play with the beans! Get out a small bowl and some cups. Start with two types (colors) of beans, and count out 50 of each into the bowl. Mix them all up with your hand. Now we're going to simulate inheritance.

On a piece of paper make three columns -­‐ label the first column LL (for light-light, or you could use RR for red-red, or whatever color beans you're using), the middle column LD, and the third column DD. Before we do any bean breeding, let's do a bit of math. Based on what we've talked about already, answer these questions:

1) If you reach into the bowl and randomly (without peeking!) select one bean, what is the probablility it will be a "light" bean?

2) If you put that bean back in the bowl and mix it around, what is the probability of selecting another light bean?

The probability for each independent draw is 50% (0.5). So, what is the probability of drawing two light beans in a row (LL)? It's the product of their independent probabilities -­‐ (0.5) x (0.5) = 0.25, or 25%.

If we know this for the light beans, it must be equally true of the dark beans (or whatever color you're using) (DD).

Now, what is the probability of choosing a light bean first and a dark bean second (LD)? It's still (0.5) x (0.5) = 0.25, or 25%.

And what about drawing the dark bean first and the light bean second (DL)? So the probability of getting DL is also 25%.

Go back to your piece of paper with the columns, and above LL write 25%, and above DD write 25%. What about the middle column? If we consider all the beans of a particular color to be identical, then LD is the same as DL.  So the probability of getting two different colors is 25% + 25% = 50%, and you can write that above the middle column.

Okay, back to our beans. Mix them up, then reach into the bowl and pull out TWO beans at once, and put a tick mark in the appropriate column (if two light beans, count one for "LL"). Put those beans back (so there are always 100 beans in the bowl in a 50:50 ratio), draw another pair, and log the result. Do this a total 20 times. Now tally up the number of occurrences of each combination (e.g., 8 LL, 4 LD, 8 DD). Then divide each of these numbers by the total number of draws (20) to determine the frequency of each outcome (e.g., 8/20 = 0.4, or 40%).   How close did this come to the statistically "expected" outcome?

Draw a line under those data and repeat this exercise 2 more times, and calculating the fractional outcomes as before.

In all liklihood, none of the three trials produced the results you predicted at the beginning. But extreme deviations from expected can occur with small sample sizes. Since we did all three of these trials exactly the same way, we can pool the results and calculate the overall frequency of each outcome by adding the results in each column and dividing by 60. For example, if for LL you got 8, 5, and 3 for the three trials, the total is 16, and you divide that by 60; likewise for the other two outcomes. What you should find is that the sum of the three draws (a total of 60) comes closer to the expected values you wrote at the top of the columns than the trials with only 20 draws. (Did you??? If you didn't , do another few draws of 20 just to convince yourself that eventually you will come close to the expected values.)

The bottom line here is that when you are working with a small sample (20), you are more likely to get frequencies that are different than expected. As the number of samples increases, the proportions should get closer and closer to the predictions.

Physical Simulation of Genetic Drift
Get out a cup, and put in it 100 beans in the proportions you got from your first trial above. (Just multiply the numbers in each column by 5.) If by some fluke you got the exact expected proportions (25% LL + 50% LD + 25% DD), pick the second trial (or third). We want to do a new simulation with a population where the frequencies of D and L are not equal. Do the same thing you did before -­‐ record the results of 20 draws of a pair of beans, this time just once. Compute the proportions, then mix up another bowl of 100 beans in these new proportions. Do one more set of 20 draws and record your data.

Let's look at your data. You know you started with L and D beans in equal proportion at the very beginning. You then used the data from the first round of draws to create a the next generation of our bean population, which just by chance alone has a different proportion of L and D. And you repeated this again, creating another new generation that probably had again a different ratio of L:D. With every subsequent generation, the frequency of alleles in the population will vary, just by chance.

This change in the frequency of alleles in our population with each generation is called genetic drift. If you continued doing these trials, say 100 or 1000 of them, you would see that the effect of genetic drift on the genetics of a population can be profound. But instead of playing with beans for a few more hours, we can do the same kind of simulation very quickly using a computer program that will create a virtual population of alleles, then randomly select, replace, and select again, in the same way you just have, for as many generations as you want. Using this, we can do a bunch of experiments very quickly.

Computer Simulation of Genetic Drift
<If you skipped doing the bean experiment because you thought you would be fine just reading it instead, or because you thought it was hokey and a waste of time, please reconsider. Without doing this yourself, you won't understand how the computer simulation works that we're about to do. Get out your beans and just do it. Trust me, it will make what follows much easier to understand.>

You can put the beans away for now, and go to the Red Lynx Population Genetics Simulator (http://scit.us/redlynx/).

To see how it works, run some simulations using the default settings -­‐ 2000 generations, population size of 800, and initial frequency of each of our alleles (A1 and A2) of 50%.

Each time you click on "Run Simulation", it will do the same thing you just did for beans -­‐ starting with a 50:50 mix of alleles, it will create 800 new individuals with alleles drawn at random. Then starting over again with alleles at their new frequencies, it will repeat again for 2000 generations. It will draw a line for each run showing how the frequency of the A1 allele changed over time. The total number of alleles in the population stays the same over time, so if A1 goes up, A2 must go down. If A1 goes all the way to 100%, that means A2 has -­‐ just by chance -­‐ been lost from the population. Likewise, if A1 goes to zero, then all of the alleles in the population are A2. Each time you click on run, it does another simulation of 2000 generations and plots a new line.

Okay, let's do some experiments. From the bean counting experiment we did above, we decided that if a population is very large, the proportions of alleles drawn randomly should be close to what is predicted. When the population is small, just by chance you can get a result that is extreme.

We can do that experiment now with hundreds of generations in a few seconds. Try this:

1) Run 10 simulations with the default settings (population size of 800) except change the number of generations to 200, which is more reasonable for purebred dogs. How many times was the A1 allele lost from the population (its frequency went to zero)? How many times did the A1 allele go to fixation (100% A1) -­‐ i.e, A2 was lost, and all individuals were therefore homozygous for A1?

2) Clear the graph, change the population size to 400, run 10 simulations, and note as above the number of times A1 was eliminated or became fixed in the population.

3) Do the same thing with population sizes of 100, 50, and 25. You should be getting the picture. What is the effect of population size on the genetic stability of our virtual population?

Now, let's simulate something more interesting. Let's pretend A1 is the gene for PRA or some other genetic disorder, and we'll make it rare in the population -­‐ say 10%. Change initial frequency to 10%, put the population size back to 800, and run 10 trials, followed by population sizes of 400, 100, 50, and 25, as before.

As before, you will notice that population size has a large influence on the stability of the allele in the population, with the results getting more and more unpredictable as the population gets smaller. In these simulations, you probably found that many times your rare PRA allele was completely eliminated from the population, but occasionally (and more frequently at small population sizes), the frequency of this allele increased, perhaps substantially.

What is the size of the reproductive population in your breed? Think about some genetic disease that occurs in your breed that is caused by an autosomal recessive allele -­‐ e.g., PRA, or von Wildebrand disease. This disease gene could start out being rare in your breed, but in just a few generations -­‐ by chance alone -­‐ it could be lost entirely, or it could become very common and even fixed in the breed. Of course, as this allele becomes more common, the frequency of affected animals will go up (because the number of homozygous offspring will increase), and suddenly a genetic disorder shows up in your breed. This isn't a spontaneous mutation -­‐ it is an allele that has been there all along, and just by chance has become more common by genetic drift.

The frequencies of all alleles can vary each generation because of genetic drift, not just disease alleles. Just by chance, dogs might get larger, or bolder, or a rare color could become more common, or they might become more sensitive to a particular disease or have more allergies. The point to remember is these changes are occurring because of changes in allele frequencies of the population.

The Power of Genetic Drift
You now might be worrying about your own breed, wondering how large your breeding population is, and what nasty gene might be lurking in your gene pool waiting for the chance -­‐ just by chance -­‐ to become a serious problem. This is definitely something breeders should be thinking about. In most breeds, only a small percentage of puppies born each year are bred, and those are not selected randomly from each litter. Under these conditions, as you have seen, some dramatic shifts in allele frequencies can be occurring by chance without breeders even being aware. Population size is far more influential on the genetic status of a breed than most breeders realize.
In the last exercise, you learned about the effect of population size on genetic drift.  This time, we’re going to start by doing a similar thing but with a bit more information.  We’re going to use a simulator called PopGen, which you can run from your computer here –

http://www.radford.edu/~rsheehy/Gen_flash/popgen/

Basic genetic drift
You will see two graph axes and along the top the selection options.  Let’s start with something you’re familiar with -

Population size = 100
A1 allele = 0.5
# of populations = 1
Number of generations = 200
Leave all others at the defaults

<If your screen is wide enough, you might see a box marked “Finite” in the extreme upper left.  Leave that box unchecked.>

Hit Run.  You will now see in the top graph that it has plotted the change in frequency of both A1 and A2 alleles, and notice that the two lines are mirror images of each other.  As the frequency of one goes up, the frequency of the other MUST go down.  At the bottom you will see a graph of the genotypes that result from the changes in allele frequencies.  Remember from last time that you calculated the frequencies of LL, DD, and LD to be 0.25, 0.25, and 0.5.  (These are the numbers you wrote as the “expected” values from the previous experiment on genetic drift.)

Now you see each of the possible genotypes plotted for the A1 and A2 alleles.  The lines for the homozygous combinations (A1A1 and A2A2) should be similar to the lines in the top graph, but the third line is for the heterozygous combination (A1A2).  You can see that the heterozygous condition is lost from the population if one of the alleles goes extinct (of course).  With the loss of one of the alleles, you’ve really lost 2 possible genotypes from the population, as well as the phenotypes those combinations produced.  Everybody in the population is now fixed for the remaining allele in the homozygous state, and if this happenes to be a gene that has a detrimental effect on the animal there’s nothing breeders can do about it.  You can’t breed away from the problem because there is no alternative allele that you can select for.  Obviously, this is bad.

You can play around with population size as you did in the previous exercise and see the effect it has on genotype, which is really what you are working with as a breeder because genotype determines phenotype.

Fitness effects
Biologists use the word “fitness” to refer to the liklihood that an animal will pass on its genes to the next generation. Animals that die before they reproduce have a fitness of zero.  Animals that have more offspring have a greater fitness than ones with fewer offspring.  In our population simulation, we can observe what happens when a particular genotype has a negative effect on fitness.

Leaving the settings as they were when you started the first exercise, we will now assign a detrimental effect to the A2A2 homozygous condition.  In the boxes at the top under “Fitness”, leave 1’s in the A1A1 and A1A2 boxes (1 is no detrimental effect, 0 is lethal), and change A2A2 to 0.9 – a reduction in fitness of 10%.  Run the simulation with these settings.

You will see that there is now a solid black line in the upper graph.  This is the “theoretical” curve, and you can compare that with the behavior of the A1 allele.  You should see that a reduction in fitness of only 10% has a pretty significant effect on the frequency of that allele – it is eliminated from the population more quickly than before, and of course the heterozyge combination is eliminated as well.  At the upper left, it will tell you the “mean generations to fixation = some number.  You can compare how this number changes with duplicate runs under the same conditions, and like you’ve seen before the more trials you do the closer the average response will get to the theoretical one.

Now do some experiments by reducing the fitness of the homozygous A2A2 in 10% steps, running 5 trials of each and recording the number of generations to fixation (e.g., 0.9, 0.8, 0.7, 0.6, etc.).  As you would expect, as the fitness penalty for the homozygous A2A2 increases, both the homozygous and heterozygous combinations are lost more quickly from the population.  But it takes just a tiny penalty to have an effect.  Inbreeding causes inbreeding depression, which is essentially a reduction in fitness.  In most populations of animals, the effects of inbreeding depression begin to appear at inbreeding coefficients above 5%.  What you have just seen is that even a very small reduction in fitness can profoundly affect the allele frequencies in a population, but it just takes a bit longer on average than with more severe penalties.

Bottlenecks
A bottleneck is a drastic reduction in the size of the population.  Most purebred dog breeds have a bottleneck somewhere in their past.  Many breeds were drastically reduced during wars, distemper epidemics, or when they were no longer needed as a working breed.  Other breeds were affected by artificial bottlenecks produced by the extreme dominance of a few very popular dogs in the breeding population, as happened in Standard Poodles when the Wycliffe kennel dominated the breed in the 1950’s.  In some cases, a breed was reduced to only a few dogs – Norwegian Lundehunds are all descendants of 6 dogs that were all that remained of the breed after a series of unfortunate events – and 3 of these dogs were siblings and 5 shared a grandmother.

A drastic reduction in population size can substantially alter the allele frequencies in the subsequent population.  We can simulate the effects of bottlenecks of various sizes.

Start again with these settings –

Population size = 500
A1 allele = 0.5
# of populations = 1
Number of generations = 200
Leave all others at the defaults (fitness of all genotypes = 1)
Run a few simulations at these settings so you can get an idea of the pattern this produces.

Now click the “Bottleneck!” box.  We will start our bottleneck at generation 50, end it at 55, and reduce the population during the bottleneck from 500 to 100.  Do 5 runs and record which allele (A1 or A2) was more frequent at the end of the run and whether either allele was fixed or lost (you will see the changes in genotypes in the bottom graph).

Reduce the population bottleneck to 50 (10% of the original population size), and run again 5 times, recording which allele was more frequent at the end and whether either allele was fixed or lost.  Reduce the bottleneck again to 10 and repeat, then to 5 and repeat.

Repeat these trials with the initial frequency of A1 at 0.8 (so A2 is 0.2) instead of 50%. and reducing the size of the bottleneck by steps.

You will see that a bottleneck changes the genetic trajectory of the population, and the more severe the bottleneck, the less predictable are the consequences.

Think about this.  Registration numbers for many breeds are declining. Popular sires are common. Breeders neuter most of their puppies or impose breeding restrictions to “protect their line.”  All of these things have genetic consequences for the breed that will persist for dozens – or hundreds – of generations.

Just for fun, you can do some more runs while imposing a fitness penalty for homozygous A2A2 as you did above (or improvise – apply a fitness penalty to the heterozygote and see what happens).

Founder effect
The founder effect is really just a special case of a bottleneck.  Some subset of a larger population is separated off to form a new population.  (In a bottleneck, the rest of the original population usually died.)  The number of founder dogs is the size of the bottleneck in this case.  The fewer the number of animals used to start the new population, the less likely it is that the gene pool of the subset is the same as the original population.  Many breeds were founded with just a few dogs, and many went on to suffer through a bottleneck or two as well.  A breed starts out at founding with a population of animals that are declared to be “purebred” whatever-they-are.  Generations later, the dogs might still look like the original founders because breeders are selecting for type, but the genes that aren’t under selection are subject to the effects of genetic drift and bottlenecks, with completely unpredictable results.

It doesn’t matter how many years of experience you’ve had as a breeder.  It doesn’t matter how carefully you select the dogs in your breeding program and choose among the offspring to continue on with.  Underneath the traits you can see, all sorts of things can be (and probably are) happening to allele frequencies that matter for other things, with effects that will last for generations.  And for all of these effects we’ve looked at, the size of the population has a most profound effect.

Who's tending your genetic pantry?

10/23/2014

 
by Carol Beuchat PhD

Let's pretend you are one of a group of master chefs, and you each whip up your own special meals using ingredients from a shared pantry. In the pantry there is a "replicator" gadget, and each time someone uses an ingredient they use the replicator to replace it in the pantry. If you have a well-stocked pantry and everybody remembers to use the replicator when they use ingredients, things run very smoothly.

But if somebody uses up the last of the sugar making a huge cake and forgets to run the replicator, the next chef that comes to the pantry isn't going to be making desserts that use sugar. In fact, dessert is going to be an unhappy event for everybody. If people are occasionally forgetful - or worse, lazy - the lapses in replication will add up over time. And with fewer ingredients available to you there is less variety in the menu, or you have to scramble to substitute some less suitable ingredient. No doubt about it, your cooking suffers; you can't make what you really want if you don't have the best ingredients.
Picture
A shared pantry doesn't work unless everybody shares in the responsibility of making sure that it's well managed. A few careless chefs will make things more difficult for everybody.

Managing the genetics of a breed is like managing the pantry of a collective of chefs. Each breeder is working more or less independently, mixing ingredients to create the dog of their vision, and the quality of the gene pool - the genetic pantry - affects everyone in the breed. Loss of a single gene for nitrogen metabolism from the gene pool affected the entire Dalmatian breed. The ability to mix genes in new combinations to improve a breed depends on having some variety of genes to choose from. If there is no variation, there is nothing to select from. Having a very narrow gene pool in a breed is like facing an impoverished pantry; there's only so much you can do with salt, cranberries, and barbecue sauce, and trying to come up with something incredible for dinner night after night is going to be tough. Managing the pantry is key if all the chefs will have the best possible ingredients to use in creating their culinary vision. A well-managed gene pool benefits both the breeders and the breed.

What does population genetics have to do with breeding dogs? Population genetics is about management of the gene pool, protecting the assets in the breed's genetic pantry. Who is keeping an eye on the pantry of your breed?

Read more about why understanding population genetics is important for dog breeders here.


How breeding the best to the best can be worse

10/15/2014

 
by Carol Beuchat PhD

An interesting study was just published about the genetics of behavior in the Belgian Malinois (Cao et al 2014). This is a working breed used in some of the same service environments as the German Shepherd Dog (e.g., military, security, etc), so behavior is important to the breed's function. Malinois that perform well, with good drive and initiative for work, tend to exhibit a circling behavior when in confined spaces, which is a form of obsessive-compulsive behavior. Dogs that do not display the circling behavior, and those that have very high levels of circling behavior, don't perform as well.

It turns out that a gene (Cadherin 2, CDH2; or genes in the same genomic block), that has been linked to obsessive-compulsive behavior in both Dobermans and humans might also be involved in the manifestation of these degrees of working and circling behavior in Malinois, from non-existant to extreme. Maintaining the most useful, moderate behavior in the Belgian Malinois is an example of something called "balancing selection", in which the heterozygous condition (e.g., Aa) is advantageous over either homozygous condition (AA or aa). (This is also referred to as "overdominance".) This means that breeding two dogs that are great working dogs and heterozygous won't produce better dogs, because some of the offspring will lack the drive and initiative to be good working dogs (AA), while others will have a double-dose of the CDH2 gene and be too high-strung to be useful. Because the best dogs will be heterozygous, selection tends to favor the gene combination that is the best combination of advantageous (good worker) and disadvantageous (moderate circling).

You might be familiar with other examples of overdominance in dogs. For example in the Whippet, dogs with one copy of a mutated allele of the myostatin gene (which is involved in muscle function) are significantly faster than dogs with the normal gene, but dogs with two copies of the gene are over-muscled (Mosher et al 2007). One again, the heteroygous condition is superior to either of the homozygous options.
Picture
One more interesting example is the ridge of the Rhodesian Ridgeback, which is caused by a dominant mutation (Hillbertz et al 2007). Dogs without the mutation don't have the ridge, and dogs with one copy of the mutation have the breed-typical dorsal ridge. However, dogs with two copies of the gene are predisposed to a congenital developmental disorder called dermoid sinus. Dogs without ridges are generally excluded from breeding because this is considered to be a fault, as are those with dermoid sinus. So again, the genotype resulting in the preferred phenotype is the heterozygous condition. But breeding two heterozygous dogs will result not in a litter with better ridges, but some offspring with ridges, some without, and probably some that are afflicted with dermoid sinus. (This is a simple Punnett square problem.)

These are three examples where assuming that breeding "best-to-best" will not result in "even better" because of failure to understand the underlying genetics. In fact, it can result in removing a dog from the gene pool for a genetic issue (e.g., a Malinois with extreme circling), when in fact breeding that dog to the appropriate mate (e.g., a homozygous dog with low drive) would result in heterozygous offspring that could have the perfect blend of motivation and self-control. Likewise, using Ridgebacks without ridges will produce some offspring without ridges, but it also will not produce pups with dermoid sinus.

With so many breeds facing a growing list of genetic issues as a result of the continued loss of genetic diversity, it is especially imprudent to remove dogs from the gene pool that could be used to produce offspring with the desired genotype (that is, heterozygous for the gene of interest) without the collateral damage of pups with unacceptable phenotypes.

  • Cao X, DM Irwin, Y-H Liu, L-G Cheng, L Wang, G-D Want, & Y-P Zhang. 2014 Balancing selection on CDH2 may be related to the behavioral features of the Belgian Malinois. PLos ONE 9(10): e110075. (pdf)
  • Hillbertz NHCS, M Isaksson, EK Karlsson, E Hellmen, et al 2007 Duplication of FGF3, FGF4, FGF19 and ORAOV1 causes hair ridge and predisposition to dermoid sinus in Ridgeback dogs. Nature Genetics 39(11): 1318-1320.
  • Mosher DS, P Quignon, CD Bustamante, NB Sutter, CS Mellersh, et al. 2007 A mutation in the myostatin gene increases muscle mass and enhances racing performance in heterozygote dogs. PLoS Genetics 3: 779-786. (pdf)


Picture
ICB Breeding for the Future

When Should You Spay or Neuter Your Puppy?

10/10/2014

 
by Carol Beuchat PhD

You probably heard about the recent study from a group at UC Davis vet school that found some detrimental effects of spaying and neutering in Golden Retrievers and Labradors, specifically in orthopedic disorders and cancer. This is very interesting in itself, but perhaps even more significant is that the effects on the two breeds were not the same. (I have summarized the results as graphs to make them easier to understand here.)  In the US, where most pet dogs are spayed or neutered, the fact that there might be adverse health consequences is very troublesome. 

Now the UC Davis group is hoping to leverage the huge database from their veterinary clinic to explore possible effects of spay/neuter in mixed breed dogs. And they're hoping to fund it with a crowd-sourced campaign through one of the largest platforms, IndieGogo. 

Here's how it works: The research team has prepared a little proposal outlining what they plan to do, who is involved, and how much they need to fund it. Anybody can then contribute to the funding campaign, with various perks available for donations of certain sizes. You can follow the success of the campaign on the project website and encourage your friends to support it as well.

I think this is a great idea, and the amount of money they're trying to raise is modest ($9,000).  AND, they are publishing in an open access journal, so the information will be freely available to anybody with an interest.

Check it out!
IndieGogo: When should you spay or neuter your puppy?

You can read their previous studies here:
  • de la Riva et al 2013 Neutering dogs- effects on joint disorders and cancers in Golden Retrievers. PLoS ONE, DOI: 10.1371/journal.pone.0055937
  • Hart et al 2014 Long-term health effects of neutering dogs- comparison of Labrador Retrievers and Golden Retrievers. PLoS ONE, DOI: 10.1371/journal.pone.0102241

Genetic disorders in dogs: breaking the machinery of life

10/3/2014

 
by Carol Beuchat PhD

As the list of known genetic disorders in dogs continues to get longer, it's tempting to think that most of the nasty mutations lurking in the gene pool of a breed have already been found. The number of possible mutant genes must be finite, and surely we must be close to getting things under control. Or not?

If you haven't taken (and survived) a biochemistry course, you probably know very little about the inner workings of the cell and all of the various chemical processes that must be executed perfectly. If you ask how all this works, the short answer is that it's complicated. Really, really complicated.

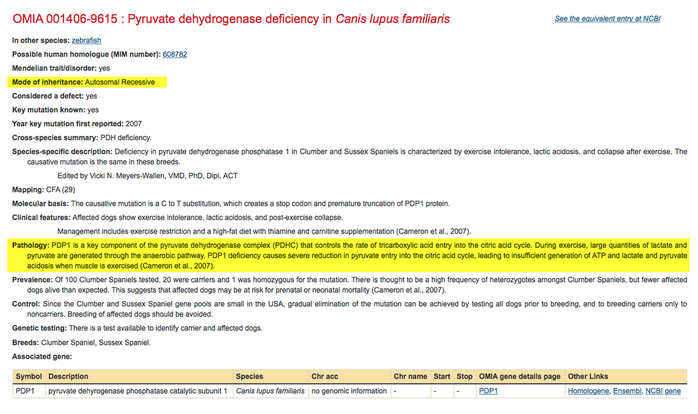
For instance, let's look at a genetic disorder caused by an autosomal recessive mutation that changes the genetic code of a particular gene by only one base (a C to T substitution), and this causes the protein made by this gene to be formed improperly. The protein is an enzyme called pyruvate dehydrogenase phosphatase 1 (PDP1), a long name for a molecule with the simple job of removing the equivalent of a water molecule (-HOH) from the compound pyruvate. This mutation causes exercise-induced collapse (EIC), which has been reported in a number of breeds, and is recorded in the database Online Mendelian Inheritance in Animals (OMIA):

Picture
OMIA indicates that PDP1 "controls the rate of tricarboxylic acid entry into the critic acid cycle". The citric acid cycle is the process in the mitochondria that produces the molecule of cellular energy called ATP. A dog without ATP goes nowhere.

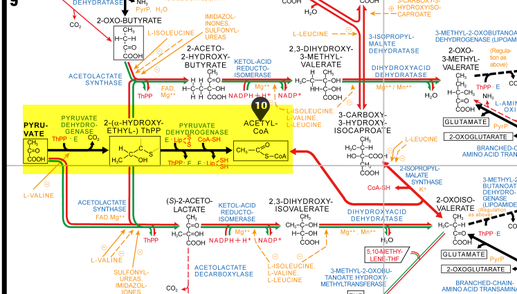
Let's have a look at what PDP1 does. Below is a schematic of metabolic pathways in the cell that looks like a map of the New York city subway system; don't let it confuse you. The thing to notice is that it's complicated (!), but we're going to look at just a tiny piece.

In the highlighted area below, you can see the molecule pyruvate on the left, and its conversion into a molecule called acetyl coenzyme A (Acetyl CoA) by pyruvate dehydrogenase.


Picture
Roche Biochemical Pathways http://biochemical-pathways.com/#/map/1

So if there's a mutation in the PDP1 molecule, the enzyme won't work properly and pyruvate doesn't get converted into Acetyl-CoA. Then the question becomes how important is Acetyl-CoA? 

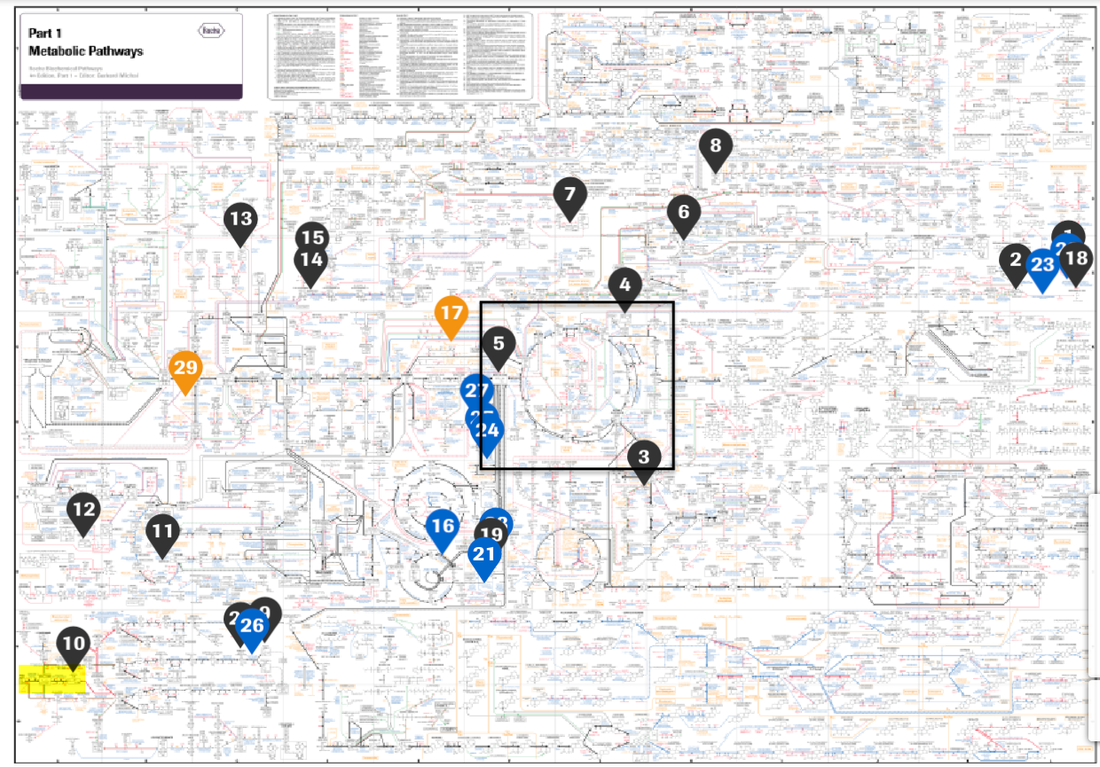
We've been looking at just a tiny part of the network of biochemical reactions that occur in the cell as the process of metabolism. Here's a broader view below, with the highlighted steps again in yellow, and there is now a box around the circular series of steps called the "critric acid cycle" right in the middle. Enzymes on this chart are blue markers, and all the places where Acetyl-CoA appears are numbered as black markers. (You can explore the map here.)

Picture
One thing that's clear is that Acetyl-CoA is a very busy molecule and is a substrate for many biochemical reactions that are essential to cell function. Shut down the enzyme that creates Acetyl-CoA, and you're in serious trouble, because the cells can't make enough ATP to support the energy cost of exercise. Just as the dog gets really going, the well runs dry of ATP and the dog collapses.

Remember from the information in OMIA above - this is a single base change in the PDP1 molecule, and the mutation is expressed as an autosomal recessive. So if one of the alleles of the gene is a functional copy, a dog is not affected; two copies though, and you have exercise-induced collapse. Of course, a mutation like this would be strongly selected against, because it produces profound dysfunction if homozygous, so we would not expect it to be common in a population of animals. But in purebred dogs, the breeding of relatives ups the odds of producing animals with a double dose of the mutated allele, and that's why we're seeing it in various breeds of purebred dogs.

You don't have to squint hard at this chart of metabolic pathways to be awed by the number and complexity of chemical steps that have to occur in just the right sequence and at just the right rate to produce the energy a dog needs not just for exercise but for life. Everywhere you see that blue enzyme marker is another protein that can be broken by just the tiniest little error when it is produced. And these are just the pathways for energy metabolism in a cell. There's an equally tangled chart on the Roche website for cellular and molecular processes.

When I took biochemistry, I could envision all of these processes in my head, following a molecule through steps that remove a water molecule, add a hydroxyl group, clip off a hydrogen, and spin off those ATPs that are the currency of life in our bodies. The complexity fascinated me, and it does even more so today as I learn about the many little glitches that can result in a dog with a disease. And looking at that chart, it's humbling to think that there must be many, many ways the whole process can be broken by just the right mutation in a critical step. I'm sure we've only just begun to scratch the surface.

    Archives

    January 2025
    November 2022
    July 2022
    May 2022
    April 2022
    March 2022
    February 2022
    November 2021
    October 2021
    December 2020
    January 2020
    August 2019
    July 2019
    June 2019
    May 2019
    April 2019
    March 2019
    February 2019
    January 2019
    December 2018
    November 2018
    September 2018
    August 2018
    July 2018
    June 2018
    May 2018
    October 2017
    August 2017
    May 2017
    April 2017
    March 2017
    February 2017
    January 2017
    December 2016
    November 2016
    September 2016
    August 2016
    July 2016
    June 2016
    April 2016
    March 2016
    February 2016
    January 2016
    December 2015
    November 2015
    October 2015
    September 2015
    August 2015
    July 2015
    June 2015
    May 2015
    April 2015
    March 2015
    January 2015
    December 2014
    November 2014
    October 2014
    September 2014
    August 2014
    July 2014
    June 2014
    May 2014
    February 2014
    December 2013
    October 2013
    September 2013
    July 2013
    March 2013
    July 2012
    April 2012

    Categories

    All
    Behavior
    Border-collie
    Herding

Blog

News


About Us

Contact Us


Copyright © 2012-2017 Institute of Canine Biology
Picture
Picture