The Institute of Canine Biology
  • HOME
  • Blog
  • Courses
    • COI BootCamp (FREE!)
    • Basic Population Genetics (FREE)
    • The Science of Canine Husbandry
    • Managing Genetics For the Future >
      • Syllabus - Managing Genetics for the Future
    • The Biology of Dogs (Open Reg )
    • DNA For Dog Breeders >
      • Syllabus - DNA for Dog Breeders
      • Open Reg - DNA For Dog Breeders
    • Understanding Hip & Elbow Dysplasia >
      • Open Reg - Understanding Hip & Elbow Dysplasia
    • Genetics of Behavior & Performance >
      • Syllabus - Genetics Behavior & Performance
      • Open Reg - Genetics of Behavior & Performance (Open Reg)
    • Strategies for Preservation Breeding >
      • Open Reg - Strategies for Preservation Breeding
    • Group Discounts
    • MORE FREE COURSES >
      • Quickie Genetics (Free!)
      • Heredity & Genetics (Free!)
      • Useful Genetics (Free!)
      • Basic Genetics Videos
  • Breed Preservation
    • Breed Status
    • Breeding for the future >
      • BFF Breed Groups
    • The "Elevator Pitch"
    • What's in the Gene Pool?
    • The Pox of Popular Sires
    • What population genetics can tell us about a breed
    • What population genetics can tell you...Tollers & Heelers
    • How to use kinship data
    • Using EBVs to breed better dogs >
      • How population size affects inbreeding
      • EBV Examples
    • How to read a dendrogram
    • Global Pedigree Project >
      • The Database
    • Finding the genes without DNA
    • How to read a heat map
  • Health Data
    • Bloat (Purdue Study)
    • Body Condition Score >
      • % Dysplastic vs BCS
    • Breed Comparions
    • Cancer
    • Cardiac
    • Cataracts
    • Caesareans
    • Deafness
    • Degenerative Myelopathy
    • Elbow Dysplasia
    • Epilepsy
    • Genetic Diversity
    • Genetic Diversity (MyDogDNA)
    • Hip Dysplasia >
      • Hip Dysplasia (Hou et al 2013)
    • Inbreeding Effects
    • Inbreeding (Gubbels)
    • Inbreeding (Dreger)
    • Lifespan
    • Litter size
    • Metabolic
    • mtDNA
    • Orthopedic
    • Mode of Inheritance
    • Patella Luxation
    • Thyroid
    • Portosystemic shunt
    • Purebred vs Mixed (UC Davis)
    • Purebred vs Mixed Breed (Bonnett)
    • Spay & Neuter Effects
    • Calboli et al 2008
    • Hodgman (1963)
    • Scott & Fuller (1965)
    • Stockard: Purebred crosses
    • Summers (2011)
  • Projects
    • How To Interpret Breed Analyses
    • Afghan Hound
    • More details about the Toller study
    • Belgian Tervuren >
      • Belgian Terv p2
      • Belgians- why population size matters
    • Bernese Mountain Dog
    • Boxer
    • Brussels Griffon
    • Bullmastiff
    • Canaan Dog >
      • Canaan analyses
    • Cesky Terrier >
      • Cesky genetic history
    • Chinook
    • Curly-coated Retriever
    • Doberman
    • Entelbucher Mountain Dog
    • Flatcoat Retriever
    • French Bulldog
    • German Shorthair
    • Golden Retriever >
      • Golden Retriever Pedigree Charts
    • Irish Water Spaniel >
      • IWS (6 Nov 17)
    • Labrador Retriever
    • Manchester Terrier
    • Mongolian Bankhar >
      • Research Updates
      • Bankhar 1
    • Norwegian Lundehund
    • Plummer Terrier
    • Otterhound
    • Portuguese Water Dog >
      • Portuguese Water Dog (pt 2)
    • Ridgeback
    • Schipperke
    • Standard Poodle >
      • The Problem With Poodles
      • 3poodle pedigree charts
      • 3Poodle Wycliff dogs
      • Poodle Genetics
    • Tibetan Spaniel
    • Tibetan Mastiff
    • West Highland White Terrier
    • Whippet
    • Wirehaired Pointing Griffons
    • UK KC Graphs >
      • UK KC Breed Status
      • UK Groups
      • KC Gundogs
      • KC Hounds
      • KC Terriers >
        • Terriers (select breeds)
      • KC Pastoral
      • KC Toys
      • KC Working
      • KC Utility
      • Australian KC
    • Breed outcrossing programs
  • Resources
    • Genetics Databases
    • Stud Books >
      • American Kennel Club stud books
      • Field Dog stud books
      • The Kennel Club (UK)
    • Learn
    • Videos about dog genetics
    • The Amazing Things Dogs Do! (videos) >
      • Livestock Management
      • Livestock guarding
      • Transportation, exploration, racing
      • Conservation & wildlife management
      • Detection Dogs
      • Medicine & Research
      • Entertainment
      • AKC/CHF Podcasts
    • Read & Watch
    • Bookshelf

Cool tricks with Kinship Coefficients, part 4: "How closely related are the dogs in my breed?"

9/7/2018

 
By Carol Beuchat PhD

One of the problems with strong selection in a closed gene pool is that the dogs become progressively more and more similar genetically. Although selective breeding in purebred dogs results in consistency, it also has the downside that a breed can find itself stuck in a genetic cul-de-sac from which it can't escape. If you need to change the direction of selection, for example to breed towards a different trait or away from a genetic disorder, you need to find dogs with the genetic diversity necessary to support selection in a different direction. Genetic diversity is the raw material for selection; you can't change anything without it.

How much genetic diversity is there in your breed? How can you find the dogs that might have the genetic variation that you're looking for?
​
There are several different ways to determine how much genetic diversity there is in your breed, but let's look at one that uses the kinship coefficients that we have already been talking about (see Parts 1, 2, and 3 in this series; links at the bottom).

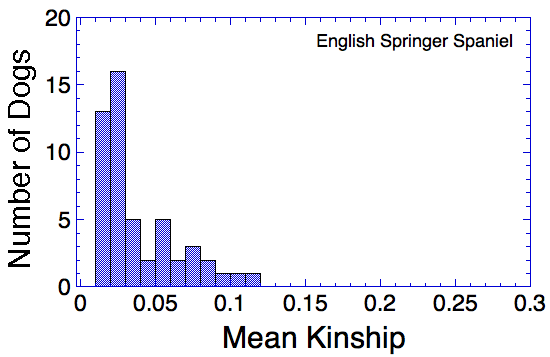
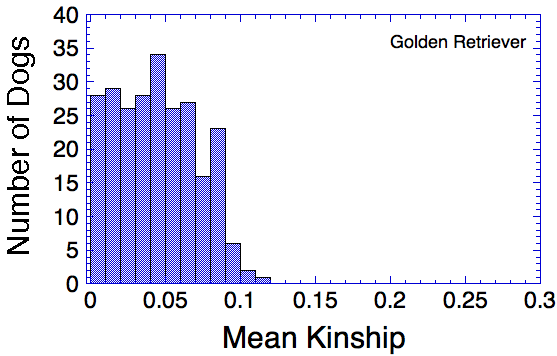
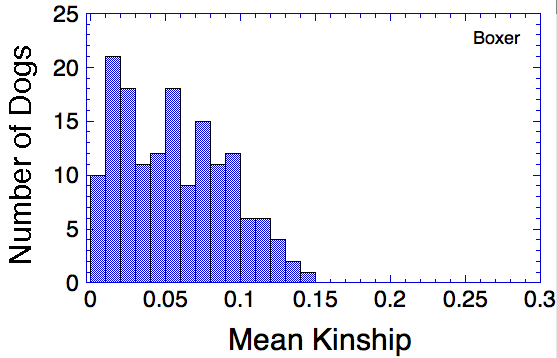
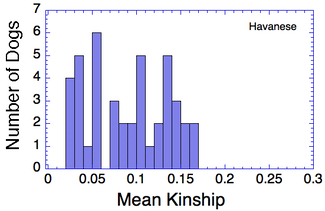
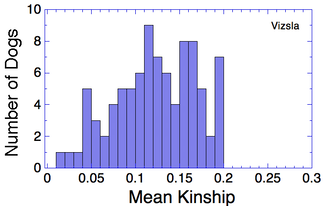
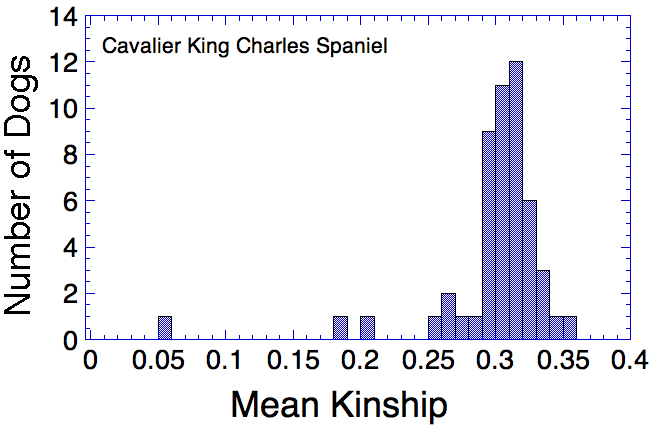
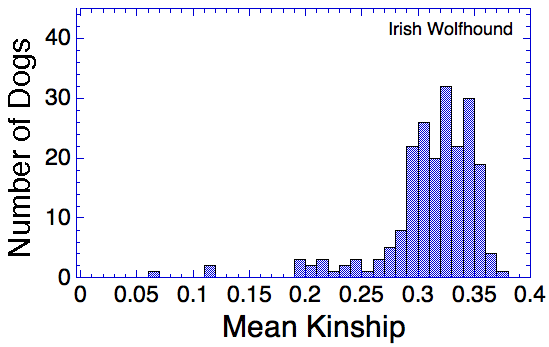
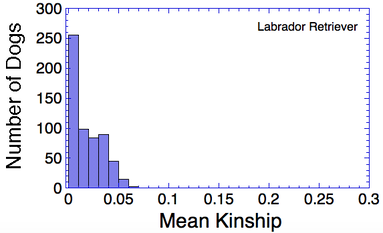
Let's say that we have a population of animals that are not closely related. If we compare the genes in each dog with those in every other dog in the population, we can compute each dog's mean kinship, which I explained in a previous post. Since we know the dogs in our population are relatively unrelated, we know that the values for mean kinship will be low (they can range from 0 to 1). If we graph the mean kinship of all of the dogs in the population, we might get a chart that looks like the first one on the left below for Labrador Retrievers, in which all of the values are less than about 0.06. On the other hand, if we have a population of closely related dogs, we might get a graph like the last one on the right below for Irish Wolfhounds, in which most of the values are greater than 0.3. If you scan the graphs for the other breeds depicted below, you will see that the distribution of values for mean kinship can vary considerably.

Picture
Picture
Picture
Picture
Picture
Picture
Picture
Picture

What do these graphs tell us about genetic diversity?

Remember that mean kinship is the average relatedness of a dog to all others in the population. The Labrador Retriever is one of the most popular breeds in the world so numbers are very high, and there are populations of show dogs, hunting dogs, personal pets that will all be a bit different from each other genetically, and populations in different countries will probably be different from each other as well. This is a breed with a LOT of genetic diversity, and the mean kinship values are mostly low. But if you were to make another graph with just the show dogs, the distribution would probably be skewed towards higher values because those dogs would be more closely related to each other than they are to field line dogs.

When you compare Labradors with Irish Wolfhounds, the graph is skewed strongly towards much higher values. This indicates in this population of over 200 dogs, the average relatedness was very high. The exception is a few dogs that fall far below the pack and are not closely related to the bulk of the population. This indicates that most of the dogs are closely related to each other.
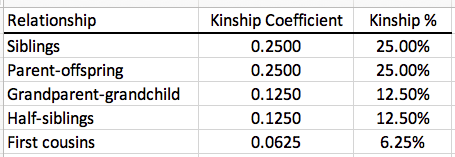
Because the kinship coefficient is based on genes that are the same because they are inherited from the same ancestors, we can interpret these graphs in terms of relatedness. If you breed two first cousins from parents that are not inbred, the predicted inbreeding coefficient of their offspring is 0.0625, or 6.25%. Looking at the graph at the top for Labrador Retrievers, we can see that most of the values of mean kinship are lower than 0.06. So we can say for this population that on average, the Labradors are less related than first cousins. 

You can do the same thing for the graphs for other breeds, using this chart for the kinship coefficients for each level of relatedness.
​
Picture

So, looking at the chart for Irish Wolfhounds (bottom right), you can see that most of the dogs have a mean kinship > 0.25; that is, on average most of these dogs are more closely related to each other than full siblings. Imagine a family reunion with a few aunts, uncles, and cousins, and 134 of your siblings. This is a breed with a very high level of average relatedness to each other. Likewise for Cavalier King Charles Spaniels. In the small sample of Havanese, there two clusters of dogs, one with a relatively high level of relatedness to each other, and another with rather low relatedness. 
There are several different ways to understand the genetic diversity in your breed. Here, we show you how you can use the kinship coefficient to provide information about the average levels of relatedness in a population of dogs. This is another tool you can add to your genetic toolbox!

We can provide genetic analyses like these for any breed from both
pedigree and DNA data using the ICB Breeder Tool.

Are you interested in using the ICB Breeder Tool with your breed?
Contact us to get started!

Picture

RELATED TOPICS

Cool tricks with Kinship Coefficients, part 1: "Is this dog really an outcross"?
Cool tricks with Kinship Coefficients, part 2: "Should I breed this dog?"
Cool tricks with Kinship Coefficients, part 3: "How can I manage a disease without a DNA test?"

To learn more about the genetics of dogs, check out
ICB's online courses

***************************************

Visit our Facebook Groups

ICB Institute of Canine Biology
...the latest canine news and research

ICB Breeding for the Future
...the science of animal breeding

Comments are closed.

    Archives

    January 2025
    November 2022
    July 2022
    May 2022
    April 2022
    March 2022
    February 2022
    November 2021
    October 2021
    December 2020
    January 2020
    August 2019
    July 2019
    June 2019
    May 2019
    April 2019
    March 2019
    February 2019
    January 2019
    December 2018
    November 2018
    September 2018
    August 2018
    July 2018
    June 2018
    May 2018
    October 2017
    August 2017
    May 2017
    April 2017
    March 2017
    February 2017
    January 2017
    December 2016
    November 2016
    September 2016
    August 2016
    July 2016
    June 2016
    April 2016
    March 2016
    February 2016
    January 2016
    December 2015
    November 2015
    October 2015
    September 2015
    August 2015
    July 2015
    June 2015
    May 2015
    April 2015
    March 2015
    January 2015
    December 2014
    November 2014
    October 2014
    September 2014
    August 2014
    July 2014
    June 2014
    May 2014
    February 2014
    December 2013
    October 2013
    September 2013
    July 2013
    March 2013
    July 2012
    April 2012

    Categories

    All
    Behavior
    Border-collie
    Herding

Blog

News


About Us

Contact Us


Copyright © 2012-2017 Institute of Canine Biology
Picture
Picture