By Carol Beuchat PhD
This is part 3 of "Cool tricks with kinship coefficients". Check out "Part 1: Is this dog really an outcross?" and "Part 2: Should I breed this dog?"
About 80% of the genetics diseases we know about in dogs are caused by a single recessive mutation. Using modern DNA technology that enables us to scan thousands or millions of markers in a dog's genome, we can usually find these broken alleles and develop a test that breeders can use to screen their dogs.
Many disorders, however, are not the result of a single mutation. For these, there might be dozens or even hundreds of genes involved. Creation of a test that will identify an affected dog with no symptoms, one likely to produce affected offspring, is not likely to happen for most of these. This is a huge problem for breeders, because many of these diseases, like cancer, epilepsy, autoimmune dysfunction are very serious and becoming more and more common. Yet they do seem to run in related dogs, so we know genetics is important. How can we manage these diseases if we don't have a DNA test? We can use kinship coefficients. Watch this.
Many disorders, however, are not the result of a single mutation. For these, there might be dozens or even hundreds of genes involved. Creation of a test that will identify an affected dog with no symptoms, one likely to produce affected offspring, is not likely to happen for most of these. This is a huge problem for breeders, because many of these diseases, like cancer, epilepsy, autoimmune dysfunction are very serious and becoming more and more common. Yet they do seem to run in related dogs, so we know genetics is important. How can we manage these diseases if we don't have a DNA test? We can use kinship coefficients. Watch this.
Kinship coefficients provide information about the relatedness of dogs by assessing pairwise genetic similarity. A statistical technique called cluster analysis can use the kinship data to construct a dendrogram - a genomic pedigree - that groups dogs together that are closely related and also indicates the relationships among groups. If a trait or disease has a genetic component, we should expect that clusters of closely related dogs are more likely to share traits than unrelated dogs because they share many of the same genes.
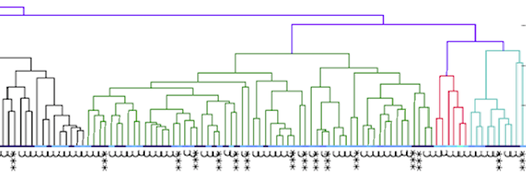
This is a dendrogram constructed using kinship coefficients computed from DNA data for 211 Irish Wolfhounds. The upper figure is the right to the right blown up so you can see a bit easier, and the lower chart is the entire dendrogram.
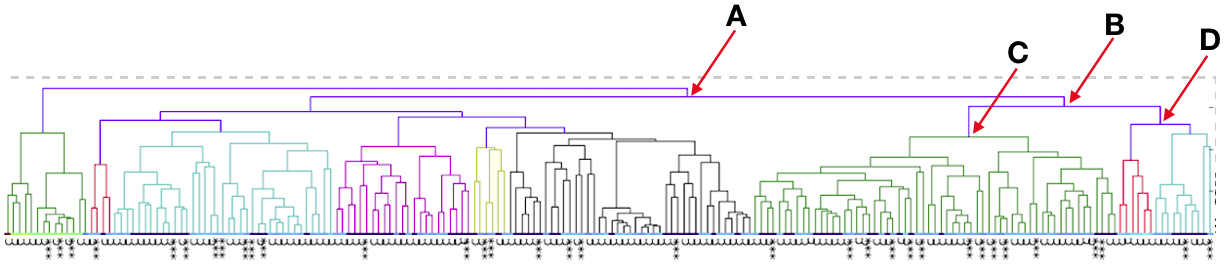
Let's take a little tour of the lower chart. You can see that the population of dogs has been separated into two smaller groups at the arrow labeled "A". If we follow the branch that comes off point A to the right, we come to a second branch at the arrow B that creates two subgroups. If we follow that branch at B to the left, we come to branch C that again splits the dogs into two groups. You can see now that is called a dendrogram because it is a picture of a structure that branches like a tree.
Dendrograms are a bit tricky to read properly and getting good at it takes some practice. You need to remember that branches can rotate around any branching point. So for instance, the very top branch that divides at A can be rotated around the junction at A so that the green group on the far left is moved to the far right to sit nest to the turquoise group. Clearly, that green group is not most closely related to the red group that was right next to it at when it was at the left end of the chart. For that matter, we can rotate the two groups on the far right (at arrow D) so the green group is now right next to the red group. So there are actually many different ways to arrange the clusters that don't change their relationships to each other. This is because relatedness is indicated by the length of the lines that connect groups or dogs. Dogs connected by very short lines are closely related, and dogs that are more distantly related are connected by longer lines. When we swivel groups around branching points, the length of the connecting lines is not changed so the information about relatedness is not changed. (Check out How to read a dendrogram)
Now we have a picture of the genetic relationships among all of the 211 dogs in this sample. We also have information about which of these dogs has been diagnosed with epilepsy. This is indicated by the three asterisks ("***") at the tip of the branch for each dog. For dogs without asterisks, this could be because they have never reported epilepsy or we have no information. So this chart can't be taken as a representation of which dogs have epilepsy and which do not. It only tells us which dogs have reported a diagnosis of epilepsy.
So, what does this graph tell us? We can see that affected dogs tend to cluster together by family groups, which likely reflects a genetic component to disease risk. Unfortunately, there are no large groups where epilepsy is completely absent. This tells you that the genetic predisposition to epilepsy is widely, but possibly not uniformly, distributed throughout this population of dogs. With some good record-keeping and the addition of data to the database, we might be able to come up with a clearer picture of the patterns of risk that can be used to make breeding choices that will reduce the number of affected dogs.
There are many breeds battling to control genetic disorders for which there are no DNA tests, or the test is unreliable for identifying dogs that will develop the disease (e.g., degenerative myelopathy). For these, kinship analysis could provide very useful information to breeders about risk of disease. Of course, the same technique described here could also be used for diseases caused by single mutations. If incidence of all genetic disorders was mapped on a dendrogram and kept up to date, breeders could notice a problem developing long before it becomes widespread in the breed and difficult to manage because of the high frequency of carriers.
One caveat about dendrograms from kinship coefficients. The cluster analysis uses the information for all dogs in a sample population to construct a tree that is most likely to reflect their true relationship. If more dogs are added to the population, the groups might be sorted differently because the relationships among them are changed. So to be useful, data for kinship should be updated regularly and needs to accurately represent the genetic breadth of the population of interest. This would be true
One caveat about dendrograms from kinship coefficients. The cluster analysis uses the information for all dogs in a sample population to construct a tree that is most likely to reflect their true relationship. If more dogs are added to the population, the groups might be sorted differently because the relationships among them are changed. So to be useful, data for kinship should be updated regularly and needs to accurately represent the genetic breadth of the population of interest. This would be true
We can produce kinship coefficient from both pedigree and DNA databases. There is some advantage to the DNA data because it will distinguish differences in relatedness among siblings whereas pedigree data does not. On the other hand, the pedigree information is invaluable because it doesn't require collecting a DNA sample and the cost of analysis. If you aren't trying to compare siblings, you need to run only one or maybe two dogs in a litter, which can reduce the expense considerably.
Think about the valuable information analysis of kinship coefficients could provide to inform your breeding decisions and managing the genetic diversity of the breed. If you have a pedigree database or genotype analysis from high density SNPs, it would be well worth doing.

To learn more about the genetics of dogs, check out
ICB's online courses
***************************************
Visit our Facebook Groups
ICB Institute of Canine Biology
...the latest canine news and research
ICB Breeding for the Future
...the science of animal breeding
ICB's online courses
***************************************
Visit our Facebook Groups
ICB Institute of Canine Biology
...the latest canine news and research
ICB Breeding for the Future
...the science of animal breeding