The analysis has revealed two genetic groups: one on the left with three dogs in red and two in green, and on the right there is a group with two blue, two magenta, and two yellow dogs. The dogs that are most closely related are connected by the fewest, shortest lines. So there is one red dog that isn't as closely related to the other two as they are to each other, but it's more related to the other red dogs than the green ones. This diagram tells us about the actual genetic similarity or relatedness of the dogs in this group.
Now, if we are trying to manage a complex genetic disorder, we can use this dendrogram to help identify where the deleterious genes are in the population even though we don't know what they are.
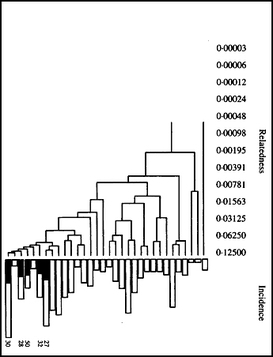
| Let's look at an actual example using elbow dysplasia in Labrador Retrievers (Ubbink et al 1998). This is a dendrogram for the dogs in a guide dog breeding program. The breeding managers wanted to reduce the risk of elbow dysplasia, so they reconstructed the genetic relationships among the dogs as a dendrogram. They then indicated on the diagram which dogs were diagnosed with elbow dysplasia. The length of each of the open bars below the baseline reflects the number of dogs in that related group, and the length of the black bar indicates the affected dogs. From this, they could easily identify the cluster of dogs where the disease was occurring by the locations of the blackend bars. They were then able to eliminate the elbow problem by breeding away from the dogs in those clusters. |
This is a great demonstration of how you can use information about genetic information to effectively manage a disorder with complex or unknown genetics.
This kind of analysis can be used for any genetic disorder or trait, without needing to know anything about the mode of inheritance or the genes involved. It can also be used to identify emerging problems that are appearing in certain lines. For problems like hip dysplasia, cardiomyopathy, autoimmune disorders, cancer, and even temperament, this simple analysis can identify the groups of dogs most likely to be at risk. There is no need to do research on the disease or identify the genes involved.
The ICB Breeder Tool uses the data from a high-resolution DNA analysis to construct the dendrogram of genetic relationships among dogs. This can then be used to provide accurate information about the distribution and incidence of a genetic issue in a population of dogs.
The ICB Breeder Tool is available now to breeders. You can read more about the other ways it can help you reduce the risk of genetic disorders and improve the health of your next litter of puppies.
The ICB Breeder Tool is available now
with a great discount while we're beta testing!
Check it out here!
REFERENCE
Ubbink GJ, J van de Broek, HAW Hazewinkel, & J Rothuizen. 1998. Cluster analysis of the genetic heterogeneity and disease distributions in purebred dog populations. Vet Rec Feb 28, 1998.
Check out
ICB's online courses
*******************
Join our Facebook Group
ICB Breeding for the Future
...the science of dog breeding
*******************
Visit our Facebook Page
ICB Institute of Canine Biology
...the latest canine news and research


