By Carol Beuchat PhD
The reason breeding is both art and science is because we can only know about part of the science. The basics of inheritance are straightforward, but beyond that things get really complicated. Plus, we will never remove the element of chance from the genetics of breeding because when the alleles get passed out to the next generation, who gets what is a matter of probability. But there is lots about breeding dogs that we can predict, if not perfectly then at least in a general way, and the more of those things we can get right the better.
| Breeding purebred dogs has never been more challenging than it is today. Breeders have to manage fewer dogs in a smaller gene pool with a list of potential genetic disorders that keeps getting longer. If diligence and commitment were all that's needed to produce healthy dogs, every puppy would live a long, happy life. Fortunately, we have amazing tools now that can help take the guesswork out of identifying and solving problems. Learn about them and how to use them, and you can address the challenges with information and a sound strategy. The things we don't know or can't know will always be essential to the "art" of breeding - the eye, the gut, and the heart - but science and the right tools can help remove a lot of the mystery. |  |
New Information For Breeders
I'm going to tell you about a few of the things becoming available to breeders in the new Breeder Tool being developed by ICB. Some are ready to use now, some are in progress, and there are more on the development list. Together, they will provide a package of tools that can help breeders identify existing problems and avoid creating new ones.
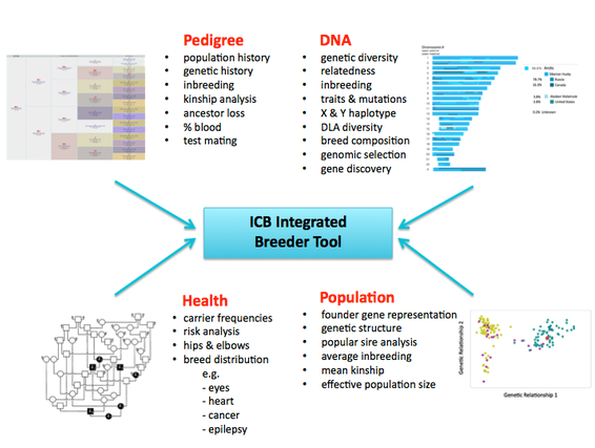
The ICB Breeder Tool is an online, interactive genetic management system that incorporates pedigree, DNA, and health information in a single, integrated framework. It is designed to address the genetics of both your next litter and the breed as a whole, so you can meet your goals as a breeder at the same time as you ensure that the health of the gene pool for the future.
The ICB Breeder Tool is an online, interactive genetic management system that incorporates pedigree, DNA, and health information in a single, integrated framework. It is designed to address the genetics of both your next litter and the breed as a whole, so you can meet your goals as a breeder at the same time as you ensure that the health of the gene pool for the future.
Here's a link to specifics and order information, but read on for more information about what it can do!
Below I will give you several examples of what the Breeder Tool does, after some basic information about the DNA analysis.
The ICB Breeder Tool is based on analysis of about 230,000 markers distributed evenly over all of the chromosomes, including the mitochondrial DNA (which is inherited from the mother) and the Y chromosome (which is inherited from the father). There are 38 autosomal chromosomes in the dog, plus the X and Y sex chromosomes. That means that there are on average more than 5,000 markers on each chromosome.
The ICB Breeder Tool is based on analysis of about 230,000 markers distributed evenly over all of the chromosomes, including the mitochondrial DNA (which is inherited from the mother) and the Y chromosome (which is inherited from the father). There are 38 autosomal chromosomes in the dog, plus the X and Y sex chromosomes. That means that there are on average more than 5,000 markers on each chromosome.
| Each marker is for a specific nucleotide, of which there are four types: A, T, C, and G. These are the molecules that make up the genes that are coiled into a double helix to form the chromosomes. The markers are called SNPs ("snips"), for "single nucleotide polymorphism". This simply means a nucleotide that is variable from animal to animal. Some of the SNPs mark the nucleotides found in mutated genes, and this enables us to tell if an animal has a normal copy of a gene or a mutation. | 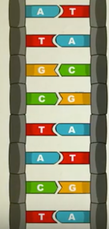 |
Because we can identify the nucleotides at each SNP, we can tell if the animal has inherited two copies of the same allele (homozygous) or has two different alleles (heterozygous). There are hundreds of markers for known genes, but the majority are for nucleotides that are "neutral" and not under selection. These allow us to estimate the overall amount of homozygosity in the entire genome.
The ICB Breeder Tool
| Mutation and Trait Testing The DNA analysis provides information for > 150 canine mutations as well as genes for particular traits like coat color and fur length. All of the mutation and traits tests are done at once on a single sample of DNA. Most labs produce only this information for the specific tested dog. It's up to you to figure out how to use this information. As you will see, there is so much more we can learn from our DNA analysis. | 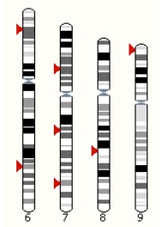 |
Homozygosity & Inbreeding
About 70% of the genetic problems in dogs are caused by recessive mutations.
A dog that inherits two copies of a broken gene will be affected. The unique features of every breed are maintained by breeding related dogs, but related dogs also are likely to share mutations and this is what causes the problems. Managing inbreeding is the only way to effectively reduce and manage genetic disorders caused by recessive mutations, so knowing the genetic relatedness of dogs you want to breed is essential.
You can compute the coefficient of inbreeding (COI) from a pedigree database. This will give you the probability of inheriting two copies of the same allele (or mutation) that originates in an ancestor on both sides of the pedigree. If you have an error-free pedigree database that goes back to founders, you can get very good estimates for the inbreeding coefficient. But most databases are less than perfect and many are incomplete.
We can use DNA to get two important pieces of information:
The two nucleotides at each SNP (paternal and maternal) are identified, and the fraction of the genome that is homozygous and heterozygous is reported as "Heterozygosity", which ranges from 1 (all SNPs are heterozygous) to 0 (none heterozygous). This is calculated by dividing the number of heterozygous SNPs to the total number of markers evaluated.
- the amount of genetic heterozygosity of the dog
- the genetic similarity of two or more dogs (e.g., comparing a bitch to a potential sire, or the puppies in a litter with each other.
The two nucleotides at each SNP (paternal and maternal) are identified, and the fraction of the genome that is homozygous and heterozygous is reported as "Heterozygosity", which ranges from 1 (all SNPs are heterozygous) to 0 (none heterozygous). This is calculated by dividing the number of heterozygous SNPs to the total number of markers evaluated.
| The heterozygosity computed for the dog can be compared to the distribution of heterozygosity for the breed or the dogs in a subpopulation. For example, heterozygosity for this dog (red marker) is 0.21 (21% of the SNPs are heterozygous). The mean for the breed is 0.26 (white marker). | 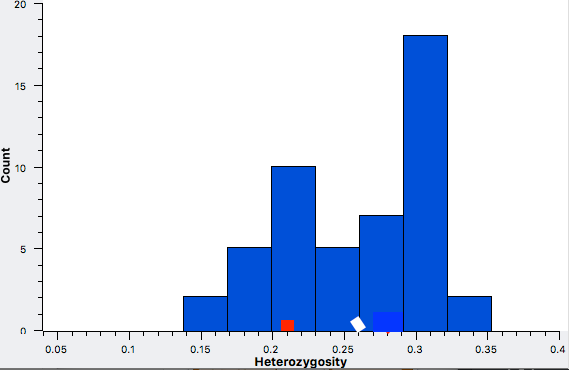 |
Evaluating Breeding Options
This is where the rubber meets the road. The more you know about the genetics of the dogs you consider for sire, the better you will be able to predict what you will get in your next litter. DNA testing can now provide information about some specific genes of importance for both health and physical phenotype. But we have tests for only a fraction of the known genetic disorders in dogs, and there are also the issues of fertility, lifespan, temperament, and other traits for which many genes are involved. We need a management strategy for those as well.
The evidence is overwhelming that levels of inbreeding higher than about 5-10% compromise many aspects of health, and especially the traits related to reproduction and what the old-time breeders called "vigor"; health and vitality might be what we would call it today. There are many signs of the negative effects of inbreeding depression in today's purebred dogs such as missed breedings, resorbed puppies, small litters, puppies that fail to thrive, and bitches without adequate milk or that don't care properly for the pups. Of course, inbreeding also increases the expression of diseases caused by recessive mutations. For all of these reasons, the single most effective thing breeders can do to improve the health of purebred dogs is to reduce the level of inbreeding.
Most breeders already use pedigree databases to determine the coefficient of inbreeding when they plan a litter, and this remains the single most cost-effective way to manage genetic risk. But accuracy depends on the quality of the database, and unfortunately most are not as good as they should be. Also, COI is a probability, a prediction of the average level of inbreeding to expect in the offspring of a particular mating. But every puppy gets a different mix of genes so each will have a different amount of actual homozygosity, and in a litter of 6 or 10 puppies there might be none that have the predicted COI. Some will be higher, some will be lower; it's simply a matter of chance. DNA can offer much better information about the genetic composition of a dog, and we can use this information to provide much better information about genetic similarity.
The ICB Breeder Tool can determine the genetic similarity of two animals by directly comparing the DNA. Dogs that are less similar genetically will produce offspring with lower inbreeding and lower risk of genetic disease. The breeder could therefore use this information when making breeding decisions.
Let's say you have a bitch to breed and have chosen four potential sires, any of which would be acceptable in terms of temperament, breed type, and health. Now the decision is to determine which sire will be the best match for the bitch in terms of managing inbreeding in the offspring.
| We can directly compare the DNA data for the bitch with that of each potential sire and determine how similar they are. The first bar in this graph compares the bitch with herself, and of course she is 100% similar. Then comparing her to the four sires, there is a range in genetic similarity from 4% to 48%. If these sires all have the type and traits you're looking for, selecting one with lower similarity (Sires 2, 3, or 4) will produce offspring with the most genetic diversity and reduce the risk of genetic disorders. | 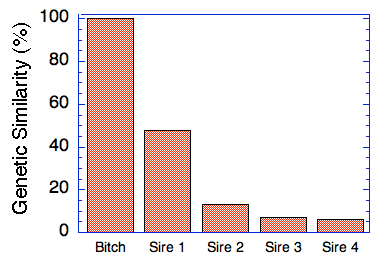 |
Before deciding which sire to use, there are other things you might want to consider in addition to the relationship coefficient. For instance, sire #4 might be a carrier for a mutation also carried by the bitch, which of course would risk producing carrier and affected puppies. You might also want to compare genetic similarity of the regions of the chromosomes where the genes for the immune system are located (e.g., the dog leukocyte antigens, DLA, on chromosome 12).
There are other ways you can use this tool. You might use it to select which puppies to keep for breeding based on what they can contribute genetically to your breeding program. You select a boy puppy that will complement a bitch you would like to breed to, or you might want to keep two pups from this litter and would like to pick the two that are least similar to each other. The RC of a pair of dogs is also about 2X the average inbreeding coefficient of a hypothetical litter of puppies, so sire #3 would produce very high inbreeding (24%, about the same as a full-sib cross) and sires #1 and 3 would produce puppies with very low inbreeding (3.5% and 2%, respectively).
Genetic Diversity & Population Structure
How do you find a dog to breed to that will bring some fresh blood to your line? About the best you can do is sit down with a pile of pedigrees and make lists, or if you're very lucky and have a good pedigree database you can produce some inbreeding coefficients from potential test matings. There are better, easier ways to do this.
The ICB Breeder Tool can compare the DNA data for many dogs to determine genetic relationships among them and display this information in a variety of ways.
The ICB Breeder Tool can compare the DNA data for many dogs to determine genetic relationships among them and display this information in a variety of ways.
Dendrograms
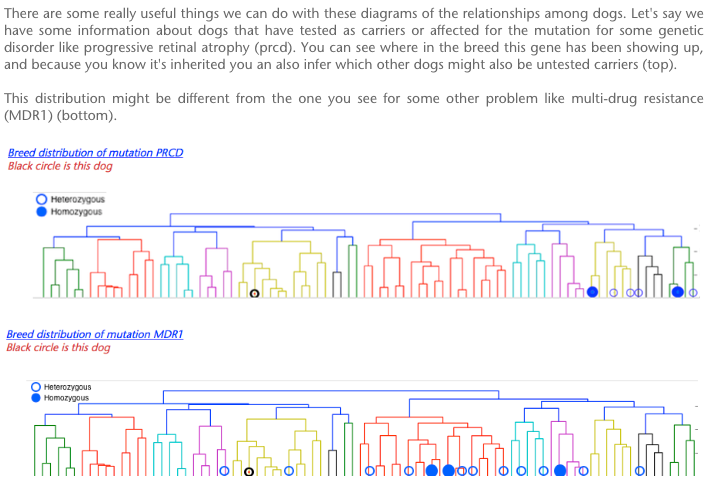
Below are several "dendrograms" - tree pictures - that cluster dogs together based on their genetic similarity. Dogs connected by shorter vertical branches are more similar to each other, and dogs connected by longer branches, or in different clusters, are less related. The dendrogram is a picture of the "genetic structure" of your population by identifying subpopulations or groups of dogs that are more closely related to each other than they are to dog in other clusters. If you're looking for an outcross, consider dogs in other clusters, and the further away they are the less related they are.
In this dendrogram for American Cocker Spaniels, there are two clear groupings, of the green dogs on the left and the red dogs on the right. Each vertical line is a different dog. Short vertical lines might indicate litter mates or half-sibs. I don't know who the dogs are, but the data probably includes dogs from both the US and UK, and it is possible that these grouping represent genetic differences that reflect geography. (You can learn more about how to interpret dendrograms HERE.)
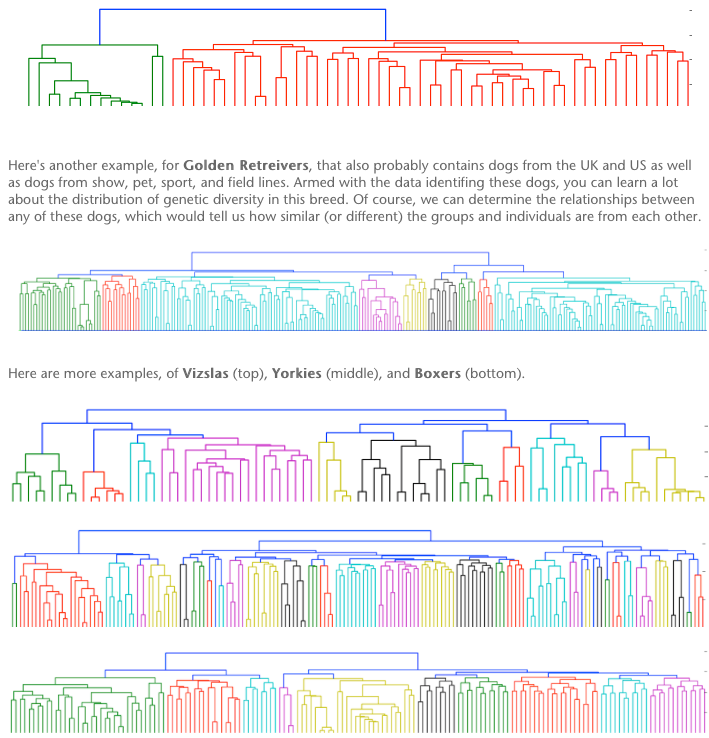
Learn more about using genetic relatedness and dendrograms to manage genetic disorders when you don't know anything about the cause.
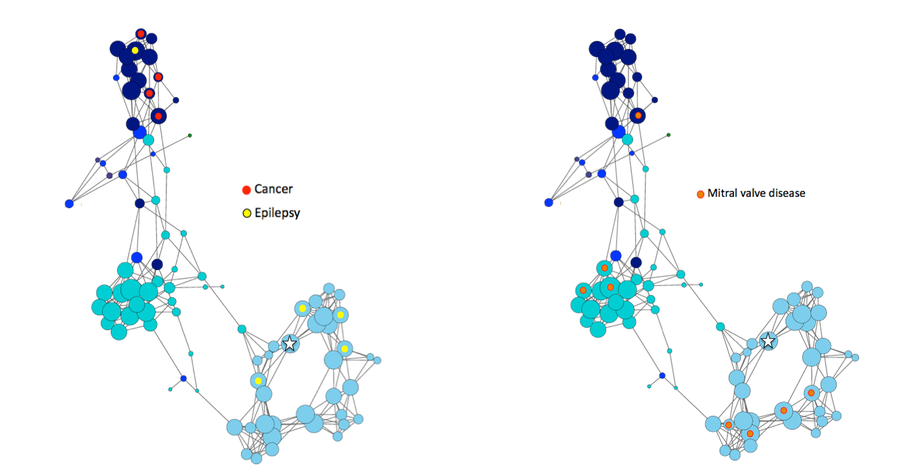
3D Point Clusters
The ICB Breeder Tool can also display the same genetic data in a very different way, here as point clusters that can show very complex relationships between animals. This can be especially useful for polygenic or complex traits for which we don't know the causative genes.
The ICB Breeder Tool can also display the same genetic data in a very different way, here as point clusters that can show very complex relationships between animals. This can be especially useful for polygenic or complex traits for which we don't know the causative genes.
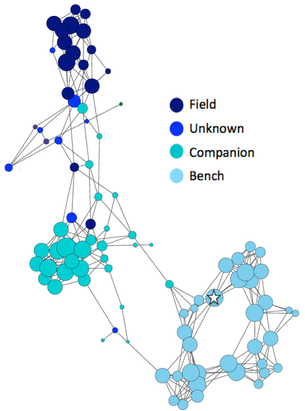
These diagrams cluster the animals by genetic similarity and, together with information about a trait or other characteristic of the dogs, it can reveal subpopulations or clusters and show how they are related. Here you can see clusters of dogs breed for different purposes (top), and below you an identify the relationships among dogs with different health issues like cancer, epilepsy, or heart disease.
The most powerful genetic tools ever
Introducing the ICB Breeder Tool
We aim to transform the way we breed dogs
by providing the information breeders need
to produce healthy, happy family dogs.
We aim to transform the way we breed dogs
by providing the information breeders need
to produce healthy, happy family dogs.
The ICB Breeder Tool provides the most powerful genetic analyses ever available to dog breeders, and there are more features coming (including estimated breeding values!). We are focused on producing tools that breeders can use NOW, so you can start improving the health of your puppies with the very next litter.
Check out the list of available DNA tests and a summary of the analyses included in the report for each dog.
The ICB Breeder Tool is in beta testing and is available now at a great price.
Check out the list of available DNA tests and a summary of the analyses included in the report for each dog.
The ICB Breeder Tool is in beta testing and is available now at a great price.
If you have questions or suggestions for features that you would like to see, please contact Dr Carol Beuchat at: [email protected]
If you'd like to take a peek at what else we're working on, read on!
Runs of homozygosity
Are you a Power User? If you are, read on!
We're going to show you something that seems a little crazy and a lot more complicated than it really is. But it's really, really cool, so don't let your eyes glaze over. I promise, it will be worth it!
Inbreeding results in homozygosity, and in more inbred animals regions of homozygosity tend to form blocks that get longer and longer. These are called "runs of homozygosity" (ROH).
Because a DNA analysis can tell us not only the amount of homozygosity in an animal's genome, it can also show us where it is, it is possible to produce a map of the chromosomes that displays these regions of homozygosity. We can line up the chromosomes end to end, from 1 to 38, and color code each SNP marker as blue for homozygous or red for heterozygous.
This is the ROH scan for a Whippet. The chromosome numbers are indicated across the top, and the strip below indicates the location of markers that are homozygous in blue, and red indicates heterozygous markers.
You can see areas where there are regions of high homozygosity as blocks of blue, such as on chromosomes 3 and 4.

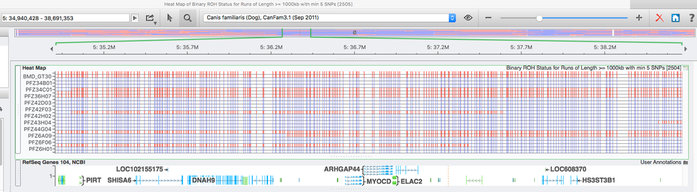
We can zoom in on a scan to see more detail. This is a set of scans for three animals with the chromosome numbers across the top indicating that this is chromosome 7 with some of 6 and 8 on either side.
You can clearly see that the first dog has long stretches of high homozygosity, while the regions of homozogity of the other two dogs are much smaller and more evenly distributed over the chromosomes.

Inbreeding tends to produce larger and larger blocks of homozygosity. But each generation, there is a stage in the formation of the gametes (eggs and sperm) called meiosis, in which DNA is rearranged by an event called "crossing over". This breaks off and swaps sections between the pair of chromosome. If these breaks occur in regions of homozygosity, the blocks will be broken up into smaller blocks.
| Over the generations and many of these crossover events, longer blocks tend to get shorter. Because of this, longer blocks of homozygosity tend to reflect recent inbreeding, and smaller blocks are the evidence of ancient inbreeding. | 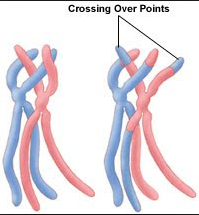 |
We can scan the chromsome for regions of homozygosity of different lengths to reveal recent versus historical inbreeding.
Here's an example of a scan from a single dog. It was scanned at three different block sizes, short (70 kb - kilobases; top), medium (1000kb; middle), and long (5000kb; bottom). Runs of homozygosity are in blue.
Here's an example of a scan from a single dog. It was scanned at three different block sizes, short (70 kb - kilobases; top), medium (1000kb; middle), and long (5000kb; bottom). Runs of homozygosity are in blue.
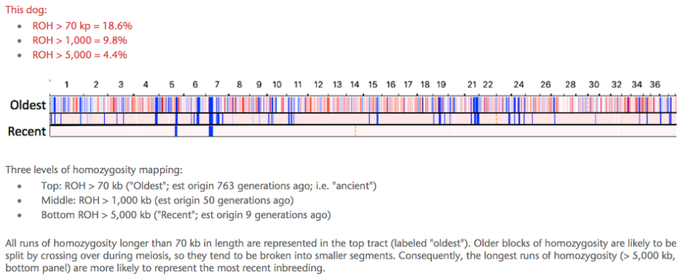
The scan on the bottom marked the longest runs of homozygosity (5000kb), and you can see two regions where there are lots of these long blocks on chromosomes 5 and 7. This should represent the most recent inbreeding.
The top scan for blocks longer than 70kb also captures the very long blocks, so the blocks on the bottom strip appear on the top one as well. But the short scans also reveal that there are many regions of shorter runs of homozygosity that reflect the accumulated inbreeding over hundreds of generations. This historical inbreeding might even have occurred even before the origin of the breed.
The top scan for blocks longer than 70kb also captures the very long blocks, so the blocks on the bottom strip appear on the top one as well. But the short scans also reveal that there are many regions of shorter runs of homozygosity that reflect the accumulated inbreeding over hundreds of generations. This historical inbreeding might even have occurred even before the origin of the breed.
There are some cool things we can do with these ROH charts.
First, because they document homozygosity, we can use the total length of the homozygous blocks to compute the actual level of inbreeding. We simply add up the lengths of the blocks and divide by the total length of the genome, and multiply by 100 to express it as a percentage. So for the dog above using the scan for the shortest blocks (70kb), the inbreeding level for this dog is 18.6%.
First, because they document homozygosity, we can use the total length of the homozygous blocks to compute the actual level of inbreeding. We simply add up the lengths of the blocks and divide by the total length of the genome, and multiply by 100 to express it as a percentage. So for the dog above using the scan for the shortest blocks (70kb), the inbreeding level for this dog is 18.6%.
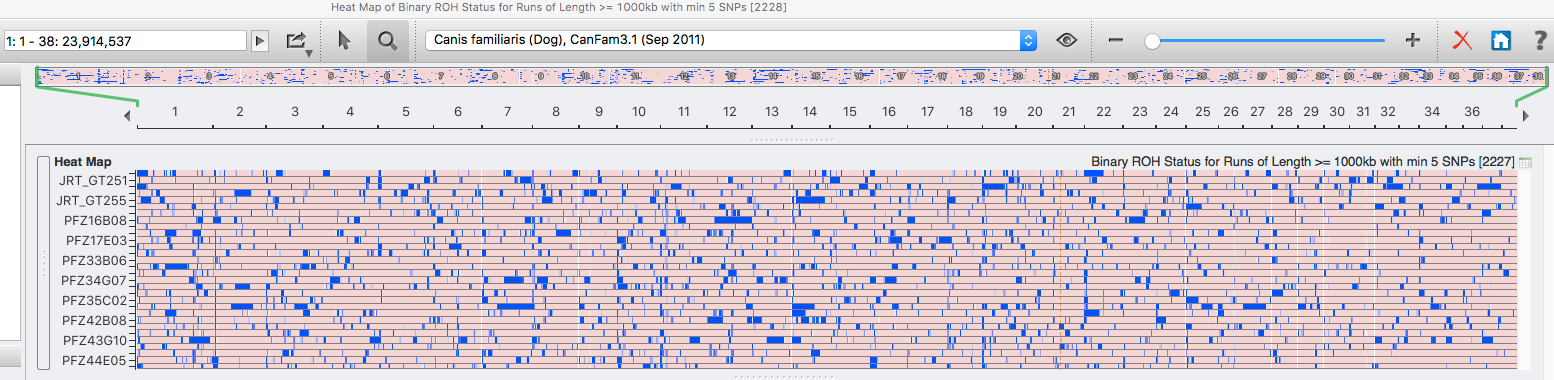
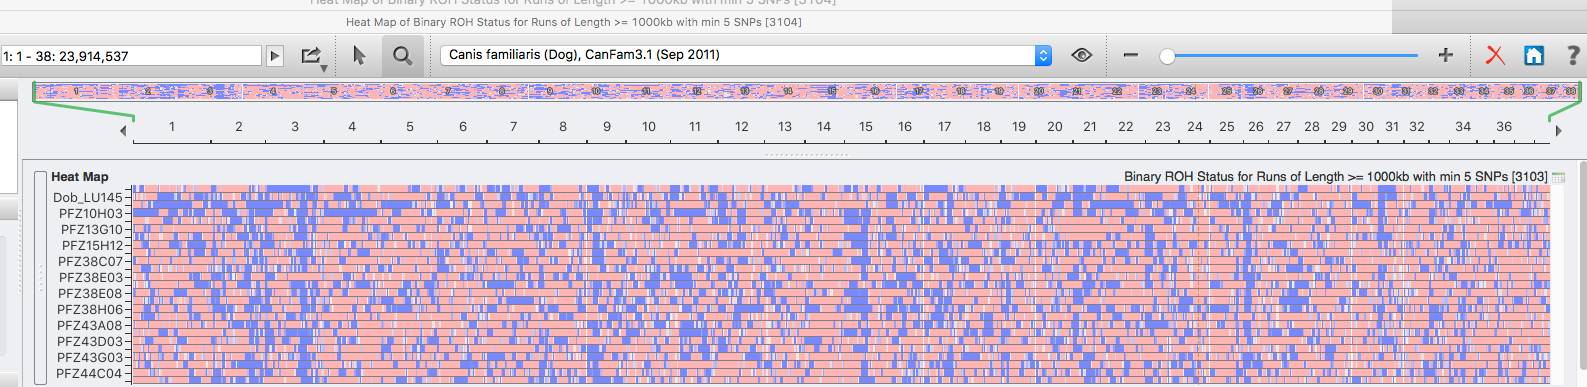
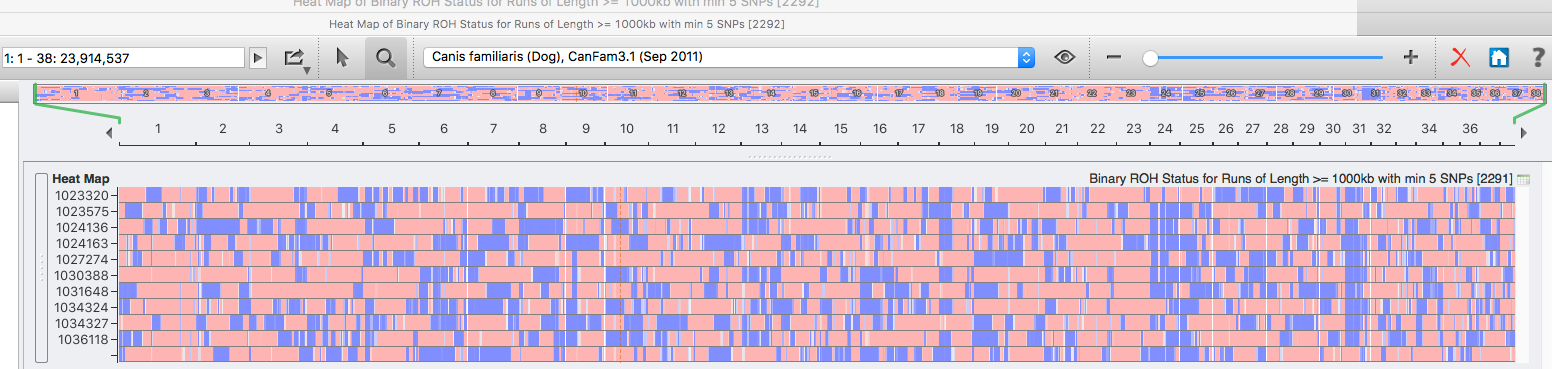
Another useful thing we can do is compare the ROH scans for multiple dogs at a time. Below is a panel of scans for 12 Bernese Mountain dogs, all scanned for runs of homozygosity longer than 1000 kb, over all 38 chromosomes.
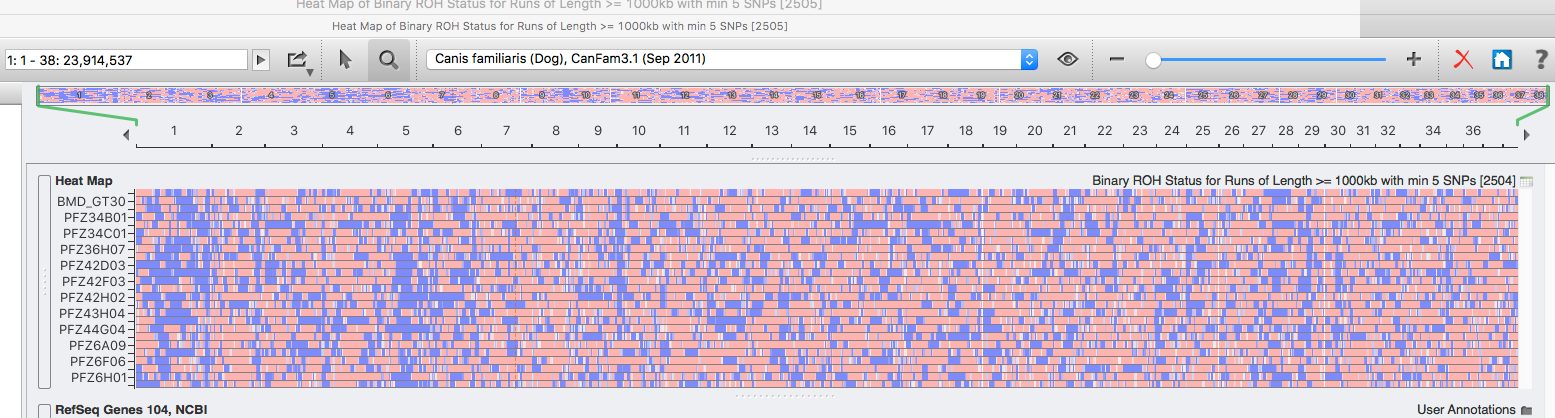
One thing you might notice are regions of shared homozygosity that are evident as vertical blue stripes. These regions might contain genes for type that are strongly selected for in every dog, or they might reflect a bottleneck or other event that resulted in many descendants of a particular dog sharing the same pattern of homozygosity.
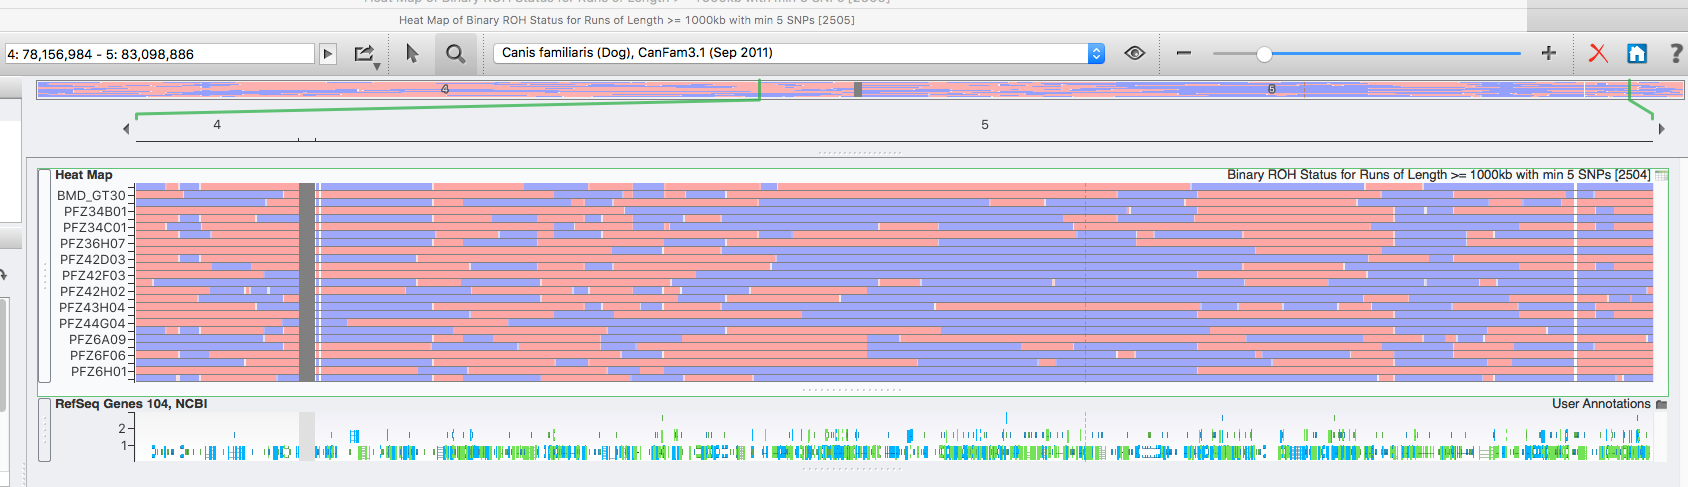
How can a breeder use this information?
Let's say that you're contemplating using several different sires with similar levels of inbreeding. By comparing the patterns of homozygosity in a bitch and potential sire, you can choose the dog that reduces the areas of shared homozogysity and will produce less homozygosity in the puppies.
Runs of homozygosity also provide a really interesting way to compare the inbreeding in different breeds of dogs. Below are scans of multiple dogs (all at the same resolution of ROH>1,000 kb) for village dogs from India, mixed breed dogs, Jack Russell Terriers, Dobermans, and Chinook. The differences among these groups are striking. Blocks of homozygosity increase in length with inbreeding and they also tend to have high linkage, which means that entire blocks tend to be inherited together. Obviously, selection for particular traits gets harder and harder as these blocks of homozygosity increase in length, and of course the amount of genetic variation is low in these areas, both of which make things more difficult for the breeder. Outcrossing reduces homozygosity and tends to break up these blocks of homozygosity, which is why the first generation from an outcross might not be exactly what you're looking for, but improvement and refinement is much easier.
Village dogs - India
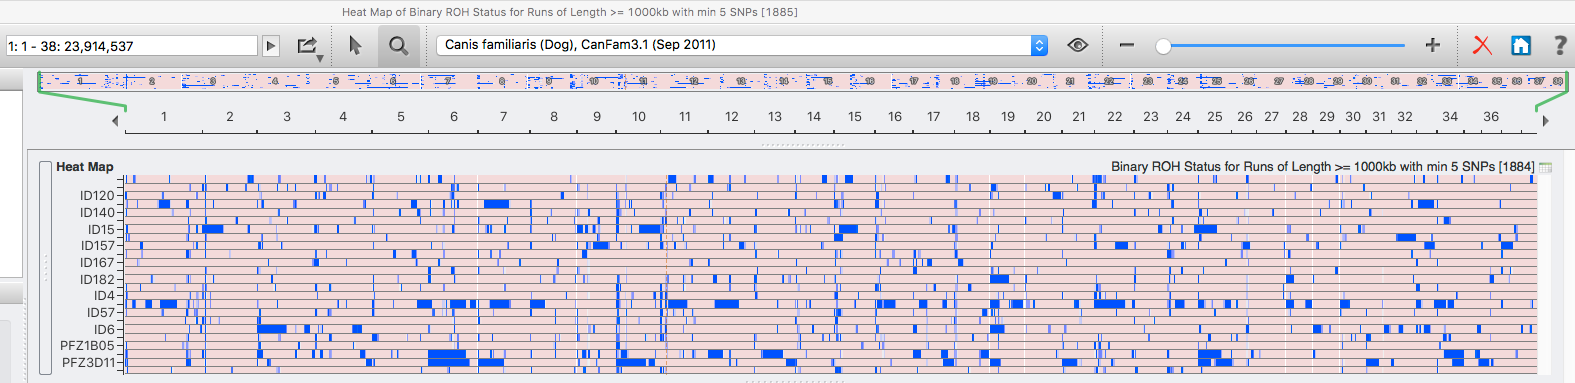
Mixed breed dogs
Jack Russell Terrier
Doberman
Chinook
There is more information and examples of Runs of Homozygosity in our two-part tutorial HERE.