By Carol Beuchat PhD
Breeders want to produce puppies that are healthy, long-lived, and have the type and traits that define the phenotype and behavior of the breed. The main tool used to guide breeding decisions is the pedigree, which records the history of the dogs in the breed. This can be paired with health and trait information to select dogs for mating that are likely to produce the desired offspring.
This is how we have bred purebred dogs for more than 100 years. In the last decade, the development of DNA tests for specific genes has allowed breeders to "see" what they're doing, allowing selection of dogs that have specific genes for traits as well as those carrying deleterious mutations, taking some of the guesswork out breeding for phenotypic traits like coat characteristics (color, long or short, straight or curly, etc) or body size, as well as an ever-increasing list of mutations associated with diseases or disorders.
| The ability to know the genotype of specific genes in the DNA of an individual dog represents a potentially huge advance in the ability of the breeder to improve the accuracy of selective breeding. Despite this, breeders still struggle with new genetic issues to manage that arise as a result of the unmasking of recessive mutations by inbreeding. To control inbreeding and reduce this problem, breeders need good information about the genetic relatedness of individual dogs. They could get at this using a pedigree database, but few breeds have the complete pedigree information necessary because of missing data or errors. Because of this, the information about relatedness that would be enormously helpful in making breeding decisions is currently unavailable to breeders. |  |
Addressing the pedigree problem should be at the top of the list of things breeders should do to improve the ability of breeders to control inbreeding and the expression of genetic disease.
Breeders are familiar with the standard 5 (or more) generation pedigree chart that shows ancestors of a specific dog. However, most breeders are not familiar with the treasure trove of information that can be extracted from a pedigree database. Here are some of the statistics about a breed that can be extracted from a pedigree database and which should be part of every breeder's toolbox for proper genetic management. These terms are "jargon" and likely unfamiliar to you - and they go by somewhat nerdy names - but fear not. Keep the definitions in front of you for reference, and look up definitions as necessary when you review the data for your breeds or others.
To make the best possible breeding decisions, breeders should have these tools in their tool box.
Effective number of founders (fe)
Most breeds go back to a small population of "founder dogs", those individuals that contributed to the allelic variation in the original population. The genes in these founders define the size of the original gene pool. However, some of this original diversity is lost over time due to genetic drift (random chance) and selection, so the current population's gene pool will be smaller.
To estimate the size of the current gene pool, we can compute the "effective number of founders" (fe). This is an estimate of the number of founders that would produce the current genetic diversity of the population if all contributed equally to subsequent generations. This is a measure of the fraction of the genes contributed by the founders that still remain in the population. Alternatively, it represents the fraction of the original genetic diversity of the breed that has been lost due to genetic drift or selection.
Founder genome equivalents (fg)
This is the number of hypothetical founder dogs that could produce the same genetic diversity of the current population if each founder contributed equally and there was no loss of founder alleles through genetic drift.
This is the number of hypothetical founder dogs that could produce the same genetic diversity of the current population if each founder contributed equally and there was no loss of founder alleles through genetic drift.
Effective number of ancestors (fa, fe/fa)
The statistics for the effective number of ancestors, fe, is the minimum number of ancestors - which can be founders or not - needed to explain the genetic diversity of the current population. If there have been no population bottlenecks, fa will equal fe. The number and severity of bottlenecks will be reflected in the ratio of fa and fe. If fe/fa is equal to one, the genetic diversity in the current population is the same as in the ancestors; that is, there has been no loss of genetic diversity due to a bottleneck. Most dog breeds have suffered population bottlenecks as a result of wars, disease, changes in the need for particular types of dogs (e.g., herding), or fluctuations in popularity. The higher the ratio fe/fa, the greater the magnitude of the genetic bottleneck.
The statistics for the effective number of ancestors, fe, is the minimum number of ancestors - which can be founders or not - needed to explain the genetic diversity of the current population. If there have been no population bottlenecks, fa will equal fe. The number and severity of bottlenecks will be reflected in the ratio of fa and fe. If fe/fa is equal to one, the genetic diversity in the current population is the same as in the ancestors; that is, there has been no loss of genetic diversity due to a bottleneck. Most dog breeds have suffered population bottlenecks as a result of wars, disease, changes in the need for particular types of dogs (e.g., herding), or fluctuations in popularity. The higher the ratio fe/fa, the greater the magnitude of the genetic bottleneck.
Mean kinship (MK)
This is an index of the average degree of genetic similarity or relationship between an animal and other members of the population. An animal with many relatives in the population will have a high degree of genetic similarity to many animals, and its MK value will be high; an animal with few relatives will have a low MK. Animals with no relatives in a population have MK = 0%. Consequently, animals with lower values of MK are genetically more valuable in the population because they carry alleles that are uncommon or rare. Every time an animal is born or dies in the population, the MK of all of the animals change because alleles in the new animals become more common and those in the animals that die become less common. The coefficient of inbreeding of an animal is equal to the kinship of its parents; so the greater the genetic similarity between two animals, the greater the risk of inheriting two copies of the same allele.
This is an index of the average degree of genetic similarity or relationship between an animal and other members of the population. An animal with many relatives in the population will have a high degree of genetic similarity to many animals, and its MK value will be high; an animal with few relatives will have a low MK. Animals with no relatives in a population have MK = 0%. Consequently, animals with lower values of MK are genetically more valuable in the population because they carry alleles that are uncommon or rare. Every time an animal is born or dies in the population, the MK of all of the animals change because alleles in the new animals become more common and those in the animals that die become less common. The coefficient of inbreeding of an animal is equal to the kinship of its parents; so the greater the genetic similarity between two animals, the greater the risk of inheriting two copies of the same allele.
Effective population size (Ne)
Effective population size is the size of an "ideal" population of animals that would have the same rate of inbreeding, or decrease in genetic diversity due to genetic drift, as the real population of interest. It is not the same as census size, which is the actual number of individuals in a population. Ne reflects the "genetic size" of the population in that it depends on the number of animals that are breeding, which will always be less than the census size of the population. The rate of inbreeding in a population increases as Ne get smaller, so it tells you about the "genetic behavior" of the population in terms of how fast inbreeding will increase in the future. For a sustainably breeding population, the value of Ne should be at least 100, and some recommend at least 500 (the rate of inbreeding will be slower with higher Ne).
Effective population size is the size of an "ideal" population of animals that would have the same rate of inbreeding, or decrease in genetic diversity due to genetic drift, as the real population of interest. It is not the same as census size, which is the actual number of individuals in a population. Ne reflects the "genetic size" of the population in that it depends on the number of animals that are breeding, which will always be less than the census size of the population. The rate of inbreeding in a population increases as Ne get smaller, so it tells you about the "genetic behavior" of the population in terms of how fast inbreeding will increase in the future. For a sustainably breeding population, the value of Ne should be at least 100, and some recommend at least 500 (the rate of inbreeding will be slower with higher Ne).
Equivalent Complete generations (EqG)
This is an estimate of the completeness of the pedigree database you are using. Missing data will reduce EqG and result in underestimation of inbreeding calculated from a pedigree database. A more complete pedigree database will have a higher EqG.
This is an estimate of the completeness of the pedigree database you are using. Missing data will reduce EqG and result in underestimation of inbreeding calculated from a pedigree database. A more complete pedigree database will have a higher EqG.
These five statistics computed from a pedigree database should be available for every breed as the basic tools that can be used to offer insight into the present genetic status of your breed. The are fundamental to genetic management plans to control inbreeding (and therefore genetic disease) as well as mating strategies to protect genetic diversity. Instead of flipping through piles of printed pedigrees trying to estimate inbreeding and relatedness of individual dogs, these statistics provide quantitative information that can help you make the best possible breeding decisions.
Here are some examples of these statistics for a variety of breeds (from Mabunda et al 2022).
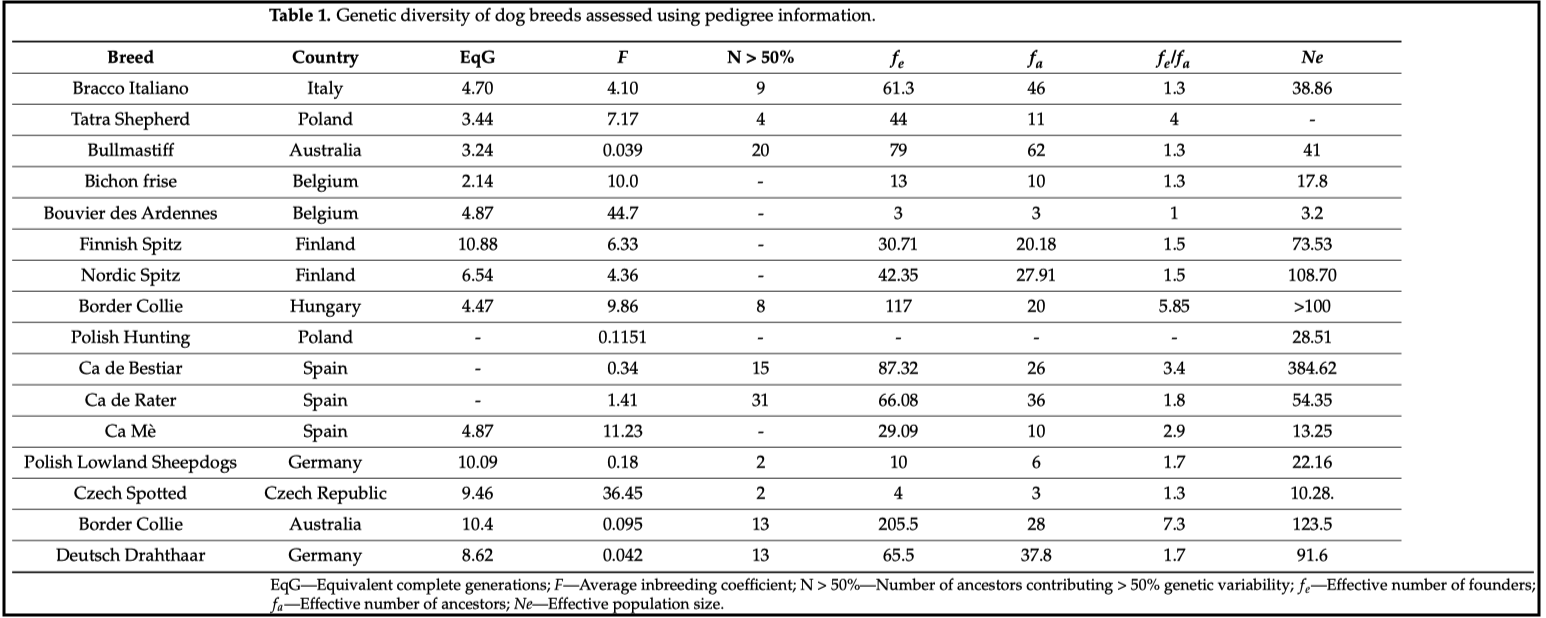
A quick look at these data can tell you about the genetic status of each breed. For example, the Finnish Spitz has the most complete pedigree database of these breeds (EqG = 10.88), so the statistics for this breed will be more reliable than for other breeds with lower EqG. The inbreeding coefficient (F) for the Finnish Spitz calculated from the pedigree data is 6.33%. As explained above, this is much lower than the inbreeding coefficient determined from DNA (F = 28.5; Bannasch et al 2021). The ratio of fe/fa (1.5) indicates a loss of some of the genetic diversity that was present in the founder population. The values of Ne range from 384 (Ca de Bestiar) to only 3.2 (Bouvier des Ardennes), and the value for Finnish Spitz is 75.53.
Ne can be increased by balancing the number of male and females used in breeding. Since fewer males are used than females in most breeds, the simple solution to low Ne is increasing the number of males used in the breeding program.
Ne can be increased by balancing the number of male and females used in breeding. Since fewer males are used than females in most breeds, the simple solution to low Ne is increasing the number of males used in the breeding program.
The data for these breeds can give you an idea of the genetic health of each breed. Some have small founder populations (e.g., fe = 3; based on the pedigree data), and only two populations have gene pools greater than 100 (fe = 117 and 205.5, for Border Collies in Hungary and Australia, respectively). Some breeds have dangerously low Ne (Bouvier des Ardennes), some have experienced a significant bottleneck (Border collie, Hungary), high inbreeding (36.45% and 44.7%, for Czech Spotted dog and Bouvier des Ardennes, respectively.
This information about a breed can give you a "heads up" spot check of a breed's genetic health. Having a large population size can be very misleading, but beyond the number of dogs and maybe an underestimate of the inbreeding coefficient, breeders do not have the basic information about the genetics of the population that is summarized here.
This information about a breed can give you a "heads up" spot check of a breed's genetic health. Having a large population size can be very misleading, but beyond the number of dogs and maybe an underestimate of the inbreeding coefficient, breeders do not have the basic information about the genetics of the population that is summarized here.
These statistics are essential tools that should be in the breeder's toolbox. Of course, every breed should have a good pedigree database, and if yours doesn't already this should be motivation to remedy this. If you do have a good pedigree database, these statistics can be computed for your current breed population, and refreshed to reveal the consequences of breeding decisions on genetic health.
If your breed does not have a good pedigree database, urge your fellow breeders to work on this. The database should be global and should go back as far as possible.
With a pedigree database in hand, I can generate the statistics I describe here to provide the first window into the current genetic status of your breed. If you are breeding for preservation and health, this information is essential.
REFERENCES
Bannasch et al 2021 The effect of inbreeding, body size and morphology on health in dog breeds. Canine Medicine and Genetics 8:12. https://doi.org/10.1186/s40575-021-00111-4.
Mabunda et al 2022 Evaluation of Genetic Diversity in Dog Breeds Using Pedigree and Molecular Analysis: A Review. Diversity 14:1054. https:// doi.org/10.3390/d14121054.
To learn more about the genetics of dogs, check out
ICB's online courses
***************************************
Visit our Facebook Groups
ICB Institute of Canine Biology
...the latest canine news and research
ICB Breeding for the Future
...the science of animal breeding
ICB's online courses
***************************************
Visit our Facebook Groups
ICB Institute of Canine Biology
...the latest canine news and research
ICB Breeding for the Future
...the science of animal breeding