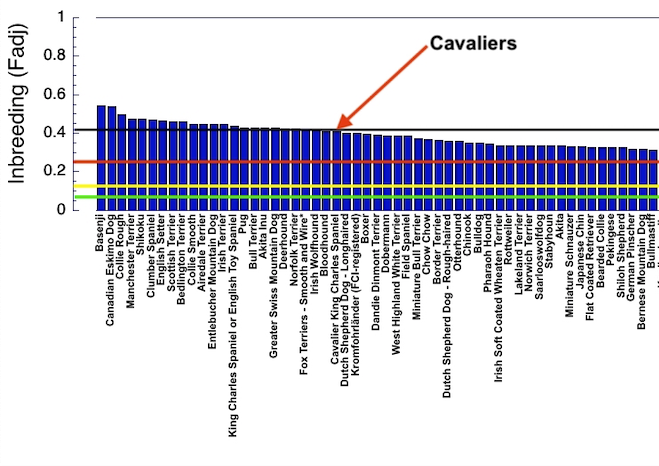
| In an earlier post, I noted that the level of inbreeding in Cavaliers is roughly 40%, as reported in two independent studies. Remember that puppies produced by cross of first cousins will have expected inbreeding of 6.25%, a cross of half siblings produces offspring with an average of 12.5% inbreeding, and a full-sib cross results in 25% inbreeding. For Cavaliers with average inbreeding of 40%, this means that, on average, the parents of a litter are more closely related than littermates. On the chart in that previous blog post, the green line is at 6.25%, yellow is 12.5%, and red is 25%. The black line is the average level of inbreeding in Cavaliers (about 41%). I have copied below the high end of the breed rankings from the chart from my previous Cavalier post. You can see where Cavaliers sit relative to the other breeds with the highest levels of inbreeding. Note that inbreeding in the King Charles Spaniel (aka English Toy Spaniel) is essentially the same as in CKCS (43%). |
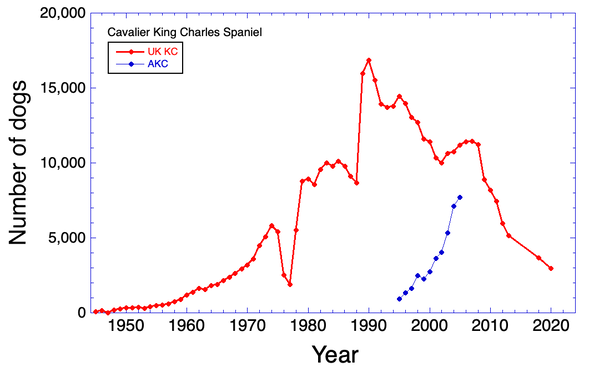
One basic measure of the health of a breed is the size of the population. Large populations are likely to have more genetic variation than small ones (but not always!), and the large number of individuals buffers the population to rapid genetic changes.. This graph shows data for registrations by the UK Kennel Club from founding (1945) to the present. My data for AKC registrations are limited, but I have included them here for information.
The data for the UK Cavaliers reveal details about the history of the breed in that country. The population size increased after it was recognized by the Kennel Club, slowly at first, then very rapidly from about 1970 to 1989, when yearly registrations reached 15,833. From 1990, registrations have generally decreased through about 2010, and since then the decline has been steady and steep. In 2020, 2,967 dogs were registered, a level not seen in the breed since about 1970, a half century ago.
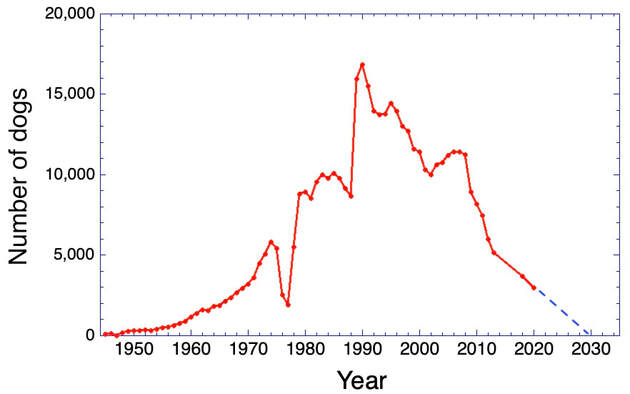
There is no indication in these data that the rate of decline in the yearly registrations is slowing. In fact, the trajectory of the line reaches zero in about 2030 (the dashed blue line in the figure below). This projected decline should be a matter of concern to breeders, especially as this is the country of origin of the breed. Smaller populations are genetically less stable, and the risk of inadvertently losing genetic diversity from lines that die out is high.
One concern about a declining population is loss of genetic diversity. This can be mitigated if breeders are careful to avoid inbreeding and they balance breeding across the population.
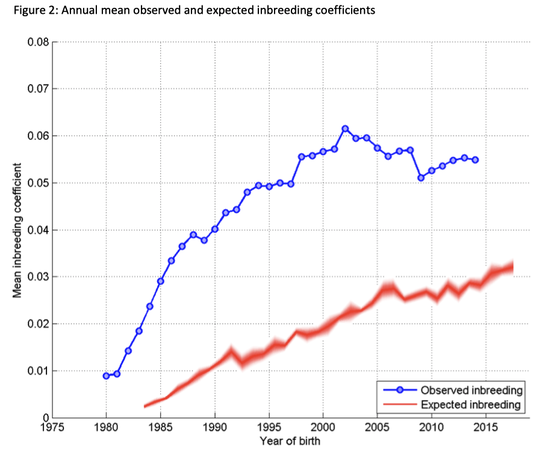
The graph below displays the observed level of inbreeding in the UK breed population between 1980 and 2015 (in blue). The red, fuzzy line is the expected level of inbreeding in this population if the animals were breeding randomly over the same period of time. The pedigree database for this analysis (which is from Lewis et al 2015) only extends back to 1980, when digital records began. While this graph is useful to detect patterns in inbreeding levels in the breed population over time, the levels of inbreeding on the graph are much lower than what we know to be more accurate inbreeding from DNA analysis, which, as noted above, currently average about 41%
On this graph, if the observed level of inbreeding is higher than the inbreeding expected from random breeding, this indicates that breeders are preferentially inbreeding; i.e., choosing to pair dogs that are more closely related to each other than the average level of relatedness in the population. This also reveals that breeders could be producing puppies with lower levels of inbreeding by pairing individuals that are less closely related.
Note on the graph that the mean inbreeding coefficient decreases after 2000. This is the result of dogs imported after the restrictions to imports were lifted in the UK in 2000. These dogs have only three generations of ancestry in the UK pedigree database, so offspring they produce will appear to be much less inbred than they really are. Remember - in a closed population, the average level of inbreeding can ONLY increase over time.
(These data are from Lewis et al 2015, and are slightly different from the registration records I have.)
Inbreeding results from mating related dogs. Nothing can damage the genetic health of a population faster and more dramatically than a popular sire. This is a dog that produces a disproportionate number of offspring, populating the breed with a large number of offspring that all share half of his genes; i.e., they are all half-siblings. But, just like every other dog, the popular sire carries unknown mutations, and these will invariably result in a genetic defect a few generations down the road. Not all of these defects will be apparent to breeders; mutations that reduce fertility, shorten lifespan, or affect behavior are just a few examples of the ways these unidentified mutations can burden the health of the breed.
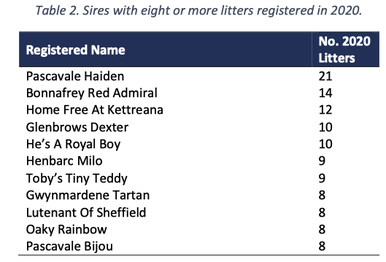
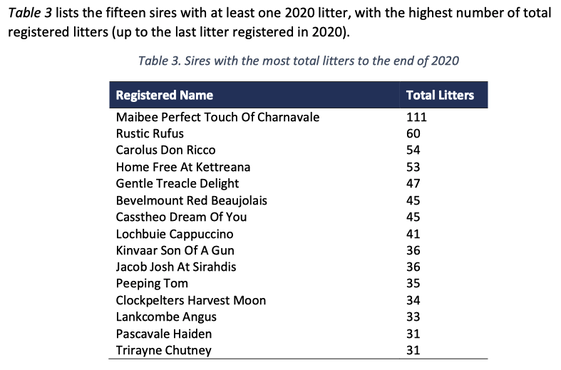
As in most breeds, the CKCS has popular sires that produce more than their fair share of offspring. These tables show that the most prolific sire in 2020 produced 30% more litters than the next most prolific sire, and 100% more than the dogs ranked 3 through 5. In terms of lifetime contribution, the top sire in 2020 produced twice as many litters as the second ranked dog (111 vs 60). To understand the true consequences of popular sires on the genetics of a population see my article The Pox of Popular Sires.
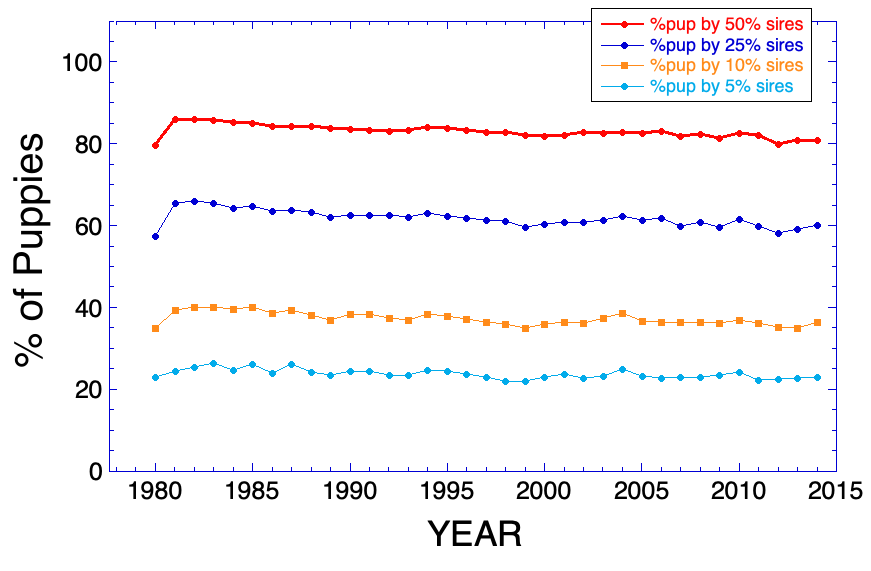
This chart also reveals the impact of the most popular sires in the breed. For instance, the top 5% of sires produce on average about 20% of the puppies in each year. Likewise, the top 50% of sires produce about 80% of the puppies, so the lower 50% of sires account for only 20% of the puppies.
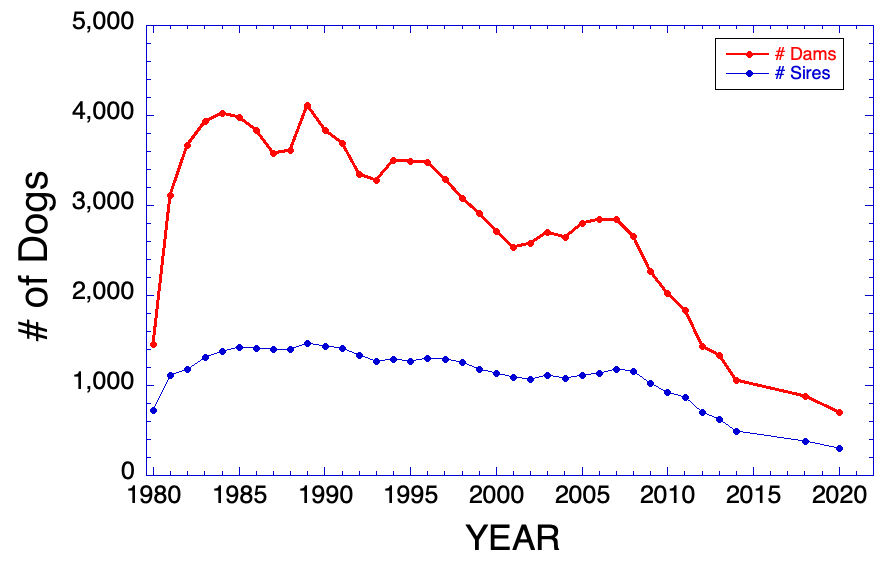
Relating to the unbalanced use of sires is the tendency to restrict breeding of sires more than dams. This is revealed in this graph of the number of sires and dams producing the puppies of a particular year. In recent years, the number of females producing litters in a year has declined dramatically, which probably reflects at least in part the decline in the size of the population. The number of males producing litters has been relatively stable for most of the last 30 years, but in the last decade has been falling.
With the exception of the first graph, which includes data for AKC registrations for a few years, the data analyzed here are from the registry of the UK Kennel Club. However, this breed is popular in many countries in the world, and we cannot assess the true genetic status of the breed without including those data (or as much as possible) as well. If you have access to data for other countries, please contact me so I can incorporate them in these analyses.
This is the first of what will be multiple installments that will shed some light on the genetic status of the Cavalier King Charles Spaniel. This information is essential to understand the history of the breed, and is even more critical or sound genetic management into the future. There are a few things already evident here that breeders should consider, perhaps most importantly, the declining registrations in the UK. As the country of origin, a healthy representation of the breed in the country has cultural importance.
Stay tuned - part 2 is coming soon!
Lewis et al 2015. Trends in genetic diversity for all Kennel Club registered pedigree dog breeds. Canine Genetics & Epidemiology 2:13. DOI:10.1186/s40575-015-0027-4
ICB's online courses
***************************************
Visit our Facebook Groups
ICB Institute of Canine Biology
...the latest canine news and research
ICB Breeding for the Future
...the science of animal breeding

